My note to Alex Salmond.. 'Greedy Bankers'?!
My note to SNP HQ.. following the attached election flyer that came through my door.. I felt the urge to send my First Minister a quick note to share thoughts.. I entitle my email 'Potential Vote Loser'!!
FAO: Rht Hon. Mr Alex Salmond, First Minister of Scotland
Dear First Minister (Alex),
As a long-term SNP supporter (voting) I wanted to draw your attention to the attached:
Scotland's heritage as a banking and financial nation cannot; should not, be down-played or derided. Why then are your local candidates playing such an obvious media-invested 'Greedy Bankers' card? Such tactics do little to effect the financial square mile of London: the well protected traders and high-flyers but does impact the average bank worker: each time they pick up a tabloid, switch on the 6 o'clock news, panel debate or every sensationalised right to reply programme. Nor, if my geography serves, do they fall into any constituency you are campaigning.
'Make the Greedy Bankers Pay Not the People - Say SNP' Ignoring Mr McNally's and Mr Smith's somewhat flawed argument vis a vis Treasury earnings derived from said bonuses; their subsequent decline and deficit and the likely return we (as taxpayers) will see from mark-market bank assets via GAPS over the next 5 years:
The media has deliberately (for whatever reason or agenda) chosen not to differentiate the average bank worker from the so-dubbed 'fat cats'. I suspect fewer than 1% of the financial workers in Scotland are eligible to the fabled high risk bonuses; and we know many earn below the UK's avg wage. I have come to expect the UK parties to take full advantage of such easy collateral but why would Scotland's party do the same, since the reputational damage is greatest on Scotland?
My wife, who has also voted SNP in the past, took great offence. She is no city banker but worked hard for RBS for 16 years, to rise through the ranks and earn her money. She did not cause the credit crunch, did not work on the asset-banking side but has had to deal with much of the fall-out: redundancies, restructures. To say she has taken an emotional battering is an understatement, like many she would love nothing more than to now leave the banking sector for good!
I myself a hard working financial analyst who lost his job in 2009; (a result of US repartionation of jobs at my firm) 1 day after Obama's inauguration! Again I would never have qualified as a 'city banker'. In fact my work was aimed at identifying risks, improving investor information and setting controls when/where possible, having worked my way up through the ranks over 10 long years.
Alas when this insult to Scotland arrived through our letterbox SNP's vote; your vote, in this household (at least), went from 2 to 1 (at best)!
If nothing else (being sth of a strategist) using such a tactic in a heavy Edinburgh-Glasgow commuter belt is at best naive; frustrating when the sub-text of their second point ('expenses') was valid if not properly played through, which infers some weakness in that claim. Alas the headline merely casts your candidates as poorly informed regarding the economy, financial regulation and the hitherto reasons why we are facing unwanted but necessary taxation rises.
Mr Salmond, you have a real opportunity to take the high ground in this election: to call a spade a spade and defend Scottish bankers. Mistakes were made by the few; mistakes were made globally, but few suffered the public back-lash so much as Scottish bank workers. Please don't blow it by allowing your party to follow the herd, by pandering to the media-drunk middle-England, blaming the wrong people and disheartening so many 000s of banking workers in Scotland; not to mention the 000s more in associated investment, wealth and pension sectors.. our nation's heritage! It is likely we will see a new party into #10 in May; time then for a strong Scottish Executive, a strong First Minister and a strong effort to rebuild our financial reputation in the UK, and globally.
Undoubtedly you will be a busy man, with both ministerial tasks and impending election, but appreciate your response as to why this household should still give SNP at least 1 vote at the next GE?
With sincerity and regards
Jon Beckett, BA, ACSI
Quote of the day: "Great spirits have always found violent opposition from mediocrities. The latter cannot understand it when a man does not thoughtlessly submit to hereditary prejudices but honestly and courageously uses his intelligence." Albert Einstein (attributed)
What is the fuss with volatility.....
Re the movement of market returns - many believe they follow a geometric or exponential Brownian motion ('GBM') which is a continuous-time stochastic process in which the logarithm of the randomly varying quantity follows a Brownian motion, also called a Wiener process. It is used particularly in the field of option pricing because a quantity that follows a GBM may take any positive value, and only the fractional changes of the random variate are significant ('deltas').
http://en.wikipedia.org/wiki/Geometric_Brownian_motion
So in practice 'brownian motion' assumes a strong tendency to trend - it says that returns won't jump from day 1 to day 2 but move up and down in fairly predictable increments.. the returns of the previous days have an impact on the subsequent day - they are not unique. This estimation of how prices move is the underlying principal for the future pricing of derivatives contracts such as options.. i.e. E.g. to buy a contract, at one price, to buy or sell the underlying asset at a future date at a future price... this is usually referred to as the 'Black-Scholes formula' or the much much earlier Bronzin model (1908). This ties up with the old-age 'law of big numbers' (or law of averages) - where returns follow a pattern around a mean and that the volatility around that mean diminishes over time.. Where those returns are then assumed to form a normal distribution (or bell curve) then the 'GBM' is symmetrical to the mean of those returns. BUT what if we do not believe upside and downside returns will be similiar?.
A LOT of analysis has been run since to dispel this view such as many variations of the the Noble winner Robert Engle's ARCH approach in 2003 ('heteroskedasticity'.. or the analysis of different dispersions/volatilities), countless variations thereof, stochastic models (see below*), extreme loss analysis, stress testing, scenario analysis and so on - it keeps the Math boys busy shall we say...
*Stochastic models: treat the underlying security's volatility as a random process, governed by variables such as the price level of the underlying, the tendency of volatility to revert to some long-run mean value, and the variance of the volatility process itself, among others. Somtimes I use Markov chain as the easiest way to visualise and understand a random process: usually it's illustrated by the cat and the mouse:
Suppose you have a timer and a row of five adjacent boxes, with a cat in the first box and a mouse in the fifth one at time zero. The cat and the mouse both jump to a random adjacent box when the timer advances. E.g. if the cat is in the second box and the mouse in the fourth one, the probability is one fourth that the cat will be in the first box and the mouse in the fifth after the timer advances. When the timer advances again, the probability is one that the cat is in box two and the mouse in box four. The cat eats the mouse if both end up in the same box, at which time the game ends. The random variable K gives the number of time steps the mouse stays in the game..
This
Markov chain then has 5 states:
State 1: cat in the first box, mouse in the third box: (1, 3)
State 2: cat in the first box, mouse in the fifth box: (1, 5)
State 3: cat in the second box, mouse in the fourth box: (2, 4)
State 4: cat in the third box, mouse in the fifth box: (3, 5)
State 5: the cat ate the mouse and the game ended: F.
To show this for a fairly infinite number of price movements is somewhat less achievable but nonetheless that's what the clever bods have done..
Otherwise most of probability, I admit, is above my head unless it descends into some sort of practical application - BUT I get the sub-plot.. stop trying to predict future patterns from regressing past performance... show me the track record of a model (after it has been created) and I'll be one step closer to being converted.. I'll touch on stress testing, extreme analysis ('extremistan') and scenarios another day..
"The Black–Scholes model disagrees with reality in a number of ways, some significant. It is widely employed as a useful approximation, but proper application requires understanding its limitations -blindly following the model exposes the user to unexpected risk. In short, while in the Black–Scholes model one can perfectly hedge options by simply Delta hedging, in practice there are many other sources of risk." Wikpedia
http://en.wikipedia.org/wiki/Black%E2%80%93Scholes
The UK Investor - The Surprise Factor
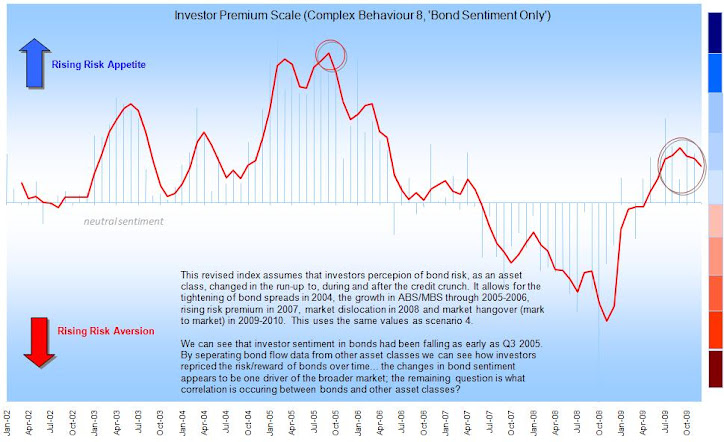
The maps in the presentation (below) really help illustrate the suprise factor of the credit crunch.. little of the previous patterns would prepare the UK investor for what was about to come. The flows show that investors did not recognise the risks inherent in 2006-2008. This is because the industry uses conventional fund metrics, which were at best outputs not guides..!
.jpg)
No comments:
Post a Comment
Note: only a member of this blog may post a comment.