One of my key aims for the CCC was diversity of opinion and to cover a broad range of investment issues for both average and experienced investors alike. To do this free of conventions, away from the marketing rhetoric of large firms. To discuss, debate, decide - on real investment issues and industry developments..
To do this I need authors.. please get in touch if you are interested.
JB
Thursday, 25 February 2010
Sunday, 21 February 2010
CAS: Do I first start with the entropy of sales flows patterns?
Entropy is basically the number of combinations/configurations a system could have.. the higher than entropy the more random the result..
"An everyday example of entropy can be seen in mixing salt and pepper in a bag. Separate clusters of salt and pepper will tend to progress to a mixture if the bag is shaken."So - if sales flow are like the salt and pepper and herding is like clusters that form mixtures then can we derive any sense of such patterns.. in some sense 'No' since thereis behaviour and organic factors but in a simple tracking sense then maybe appreciating the randomness of sales flow patterns of my first step to understanding parts of the complex adaptive system that impacts investor decisions, sales flows, performance and risk..
Saturday, 20 February 2010
CAS: Complex Adaptive Systems
I have just been conversing with John Marke who is a risk-man in both financial and defence fields.. I class him as one of the 'elightened ones'. His papers on complex adaptive systems (or 'CAS') has really opened up my mind to new possibilities and new ways to think about how to interpret randomness of mutual sales flows, risk and performance.
My personal 'moment' of freedom occurred in 2009 when I realised all the bellcurvistan (normal distribution, law of averages) stuff I had been doing on tracking mutual funds was frankly tosh and I needed to start again; (at least it allows me to engage in bell curve conversations while trying to encourage the idea of randomness)..
Previously I had spent much of 2007 and 2008 on the front line tracking high correlations across large fund groups (50,000+) listening to various seminars on the unusual ViX bottoming but other than high gearing and exceptionally concentrated equity/high yield/ABS/CDO/CMBS positions it was hard to understand the root causes.. if I had been speaking to guys like John or Nick and Kon (Black Swan group) then I might have had a better idea of the bigger CAS in play.. I of course talk of the interaction of global central banks and govt fiscal policies underlying.. if you first think of each market bull/bear not in isolation but as an interaction of multiple cycles prior (domino effect - 2D).. and then also as an interaction with other less seen elements (geopolitical movements, media expansion, health scares, natural disasters, war: butterfly effect - 3D) then I start to better appreciate CAS.
If I now think of the sales flow patterns as part of an intricate elastic web that's continually changing due to behaviours, media flow, performance/risk changes.. action, reaction, re-reaction.. then I can see why my earlier analyses were flawed.. 1) I wasn't accounting for a dynamic change in perceived riskiness of different assets (tho I was aware a delta scale was needed) and 2) I wasn't considering the presence of power laws or indeed unseen correlations to other factors (tho I had realised that media could be a root cause of volatility).
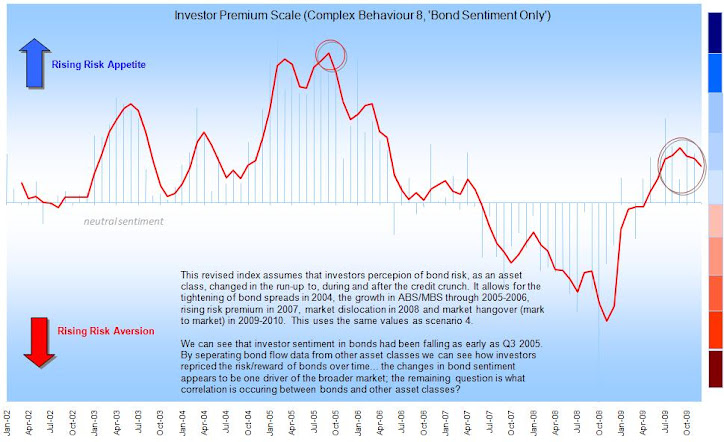
What I had really 'missed' was that I was trying to measure movements against a common sentiment 'neutral', over time, when in fact the 'neutral' was moving also.
I'm hoping I can try to apply some of John's work into better understanding sales flow trends.. and from that try to record some observations and build some sort of 'resilience' planning for investing. Whether my CAS turns out to be something like GCP (below), LPPL seismicity-based, fluid dynamics, chaos, organic or more socio-economic (behavioural) I'm uncertain.
E.g. GCP Hypothesis: "The Global Consciousness Project, also called the EGG Project, is an international, multidisciplinary collaboration of scientists, engineers, artists and others. We collect data continuously from a global network of physical random number generators located in 65 host sites around the world. The archive contains more than 10 years of random data in parallel sequences of synchronized 200-bit trials every second. Our purpose is to examine subtle correlations that may reflect the presence and activity of consciousness in the world. We predict structure in what should be random data, associated with major global events. When millions of us share intentions and emotions the GCP/EGG network data show meaningful departures from expectation. This is a powerful finding based in solid science. Subtle but real effects of consciouness are important scientifically, but their real power is more direct. They encourage us to help make essential, healthy changes in the great systems that dominate our world. Large scale group consciousness has effects in the physical world. Knowing this, we can use our full capacities for creative movement toward a conscious future."
http://noosphere.princeton.edu/
My personal 'moment' of freedom occurred in 2009 when I realised all the bellcurvistan (normal distribution, law of averages) stuff I had been doing on tracking mutual funds was frankly tosh and I needed to start again; (at least it allows me to engage in bell curve conversations while trying to encourage the idea of randomness)..
Previously I had spent much of 2007 and 2008 on the front line tracking high correlations across large fund groups (50,000+) listening to various seminars on the unusual ViX bottoming but other than high gearing and exceptionally concentrated equity/high yield/ABS/CDO/CMBS positions it was hard to understand the root causes.. if I had been speaking to guys like John or Nick and Kon (Black Swan group) then I might have had a better idea of the bigger CAS in play.. I of course talk of the interaction of global central banks and govt fiscal policies underlying.. if you first think of each market bull/bear not in isolation but as an interaction of multiple cycles prior (domino effect - 2D).. and then also as an interaction with other less seen elements (geopolitical movements, media expansion, health scares, natural disasters, war: butterfly effect - 3D) then I start to better appreciate CAS.
In reality I was looking for sequential chains of events: (event - sales flow - performace - risk - event) when actually the system was more complex than that.
If I now think of the sales flow patterns as part of an intricate elastic web that's continually changing due to behaviours, media flow, performance/risk changes.. action, reaction, re-reaction.. then I can see why my earlier analyses were flawed.. 1) I wasn't accounting for a dynamic change in perceived riskiness of different assets (tho I was aware a delta scale was needed) and 2) I wasn't considering the presence of power laws or indeed unseen correlations to other factors (tho I had realised that media could be a root cause of volatility).
What I had really 'missed' was that I was trying to measure movements against a common sentiment 'neutral', over time, when in fact the 'neutral' was moving also.
I'm hoping I can try to apply some of John's work into better understanding sales flow trends.. and from that try to record some observations and build some sort of 'resilience' planning for investing. Whether my CAS turns out to be something like GCP (below), LPPL seismicity-based, fluid dynamics, chaos, organic or more socio-economic (behavioural) I'm uncertain.
E.g. GCP Hypothesis: "The Global Consciousness Project, also called the EGG Project, is an international, multidisciplinary collaboration of scientists, engineers, artists and others. We collect data continuously from a global network of physical random number generators located in 65 host sites around the world. The archive contains more than 10 years of random data in parallel sequences of synchronized 200-bit trials every second. Our purpose is to examine subtle correlations that may reflect the presence and activity of consciousness in the world. We predict structure in what should be random data, associated with major global events. When millions of us share intentions and emotions the GCP/EGG network data show meaningful departures from expectation. This is a powerful finding based in solid science. Subtle but real effects of consciouness are important scientifically, but their real power is more direct. They encourage us to help make essential, healthy changes in the great systems that dominate our world. Large scale group consciousness has effects in the physical world. Knowing this, we can use our full capacities for creative movement toward a conscious future."
http://noosphere.princeton.edu/
Friday, 19 February 2010
Question.. so to become a contrarian..
Q... do I a) start the CISI Masters, b) take the neccessary lvl4 qual to get my individual chartered status or c) embark upon a left-field study plan in non-financial courses?
The first choice helps me gain reputation and credibility long-term, the second short-term and the last will probably make me a better non-conventional analyst.. perhaps I have just answered my question but we also have to be pragmatic, sometimes.
Courses of interest:
The first choice helps me gain reputation and credibility long-term, the second short-term and the last will probably make me a better non-conventional analyst.. perhaps I have just answered my question but we also have to be pragmatic, sometimes.
Courses of interest:
- Business Economics from a strategy pov
- Seismicity and tectonic analysis
- Financial Mechanics - random, power law based
- Computational Fluid Dynamics
- Investment Psychology - Kahnemman & Tversky type work
- Social-sciences are the cross-over in markets
Saturday, 13 February 2010
Latest Sales flow data in (to end December)
A quick note to say that I know the December sales data is in but I won't have a chance to study it until after the week after next, exams, family yada yada...
There are a couple of other things I want to do with the data also - look to see if patterns/cycles in asset rotation is possible (by throwing various different models at it) and what KISS observations are possible.. and also do a breakdown of the asset mix (risk profile) of some of the key European countries - contrast behaviours etc.. Greece and the Med countries may be of particular interest just now..!!
ttfn
JB
Thursday, 11 February 2010
Another blogger - another Black Swan
http://nicholasjdavis.wordpress.com/
http://nicholasjdavis.wordpress.com/2009/03/10/robustifying-the-global-financial-system/
'My goal is to continue to develop a concurrent expertise in future-oriented macro-economics and organizational strategy for firms, the non-profit sector and public/international institutions; however it seems that interesting opportunities to think about uncertainty, risk and the future abound everywhere around the world, so I’m trying to be prepared for many possible twists and turns in life.'Read Nicholas' report card here: posted March 10 2009..
http://nicholasjdavis.wordpress.com/2009/03/10/robustifying-the-global-financial-system/
'OK, now that we’ve sorted out the crisis-management side of the global financial crisis, and have stabilized the banks, how do we structure the global system to be more robust? Here are a few principles and ideas for robustness that a few of us here in Geneva and elsewhere have been throwing around recently in conversation.. '
Don't read this you'll hate it!
"Oh, you decided to read anyway. Strange isn't it? You see a negative headline and you go straight on to read the article below. You may even have clicked on the headline to get here in the first place. Why? You were told not to read it...! Like so many other people you have been lured in by a negative headline.
In spite of what we say about being put off by negativity, the reverse is actually true. We need to focus in on negative things - it's all part of our inbuilt survival. We need to protect ourselves from possible harm all the time, hence we are finely attuned to noticing negatives (potential threats). It means that your website visitors will be attracted to negative headlines more than to positive ones.
And remember, it is the headline that gets them to read. Even if you have enticing images or videos, unless the headline is compelling people don't read on. Eye tracking studies show that people often give-up after reading the headline - largely because they are not interested in what it is telling them.
Typically a good, popular and successful newspaper will spend more resources on the headline writing than it will on the writing of the articles themselves. Headlines make a huge difference to sales and readership in the newspaper business. The two or three words on the front page of The Sun are probably the most expensive words produced each day in the UK because without them working effectively, sales can fall. If those couple of words are right, sales can rise. Hence the newspaper agonises over those words and pays high salaries to the team putting that page together.
So, you need to ask yourself a question. How much effort do you put in to the headlines on your website? And are they focused on attention-grabbing negatives? If you merely used headlines as "labels" - including the ubiquitous "Welcome to our website" - you are not going to attract the levels of readership you want or deserve. Put in considerable effort on headlines and make as many as possible negative - you'll see a significant rise in readership and time spent on your site." Extract from IFALife. http://www.ifalife.com/
I really liked this article on IFALife by Graham Jones (Internet Psychologist) and sums up the conflict between people following news and the business model of media selling news by selling bad stories. It also keys into things I have said in the past such as sensationalism, information volatility and investor 'lag' caused by information and influences. JB
Monday, 8 February 2010
Transparency: JB's current portfolio (08.02.10).. shh (don't tell mum)!!
I promised I'd give you a run-down on my positions.. et voici! This is for approx £50k I have with a well-known wrap provider. You'll immediately spot some areas I'm overweight in (where I am really buying a lot of risk) in my case ETFs and (relative to the avg balanced investor) I'm o/w both property funds and commodities... shh (don't tell mum)!!
The cash is higher than I planned but I have a few ££££ still unallocated..
.jpg)
.jpg)
.jpg)
The cash is higher than I planned but I have a few ££££ still unallocated..
.jpg)
.jpg)
.jpg)
Sunday, 7 February 2010
Eureka...! why we should start with 10 questions; not a million
We use checklists to make information manageable and our decisions objective. This is why a set of 10 questions is better than a million. As Taleb says, humans are not good at processing lots of unique information and drawing objective decisions from them. This is why some rely on algo programs to process the questions for them. By ourselves, 10 we can do a little better.
We make information objective to make our decisions logical, by identifying and learning from errors. We're not so good at learning from the subjective or anecdotal. This is how we learn - trial and error - without which there would be less invention; less innovation, more inaction. There is a nice little Mike Jordan quote that Taleb uses about 'losing'. The fewer the # of questions the more we have a fixed point to measure against when something unexpected occurs. The point is that we don't accept; we ask 'why' and probe gaps, we try to learn. Checklists can help.
Yes, we should be wary of 'experts' and that trial and error is the basis of all experimentation: Archimedes' eureka loosely translated means 'I have found it'.. which infers a degree of searching. What better way to start a search than through a checklist of questions..
"For the ordinary man is passive. Within a narrow circle he feels himself master of his fate, but against major events he is as helpless as against the elements. So far from endeavoring to influence the future, he simply lies down and lets things happen to him.." G.Orwell.
Profit Taking Season: Bonds v Equities sales flows
Firstly a health warning - I seriously bored myself writing this post; I will try to think up something more interesting next time!
Although I'll be the first to admit the folly of predicting the future direction of markets; (as you know I am perpetually curious about what investors think).. Investors take some sort of view directly or indirectly.. where Fund of Funds are making the calls then there will be some rationale behind asset rotations.

Although I'll be the first to admit the folly of predicting the future direction of markets; (as you know I am perpetually curious about what investors think).. Investors take some sort of view directly or indirectly.. where Fund of Funds are making the calls then there will be some rationale behind asset rotations.
'I do believe that money drives markets drives money. The power of herding shouldn't be underestimated - it is a key cause of asset bubbles.'So we've had an interesting year to say the least - ups and downs but lots of ups - for any investor who saw that cheap was cheap back last March then brave - they should have lots to be happy about. Now is the season of profit taking and throwing those risk assets into something less, err, risky.. nes pas?

So the first phase bull market looks all but extinguished within the space of 10 months (some sort of record) and we look set for a more frothy and protracted recovery through 2010-2011. What is useful is that the recent dip has cooled the market a little - especially EM markets and we've seen a slowing in the flight to risk.
Into Q4 we saw a move away from Equities towards Bonds as the chart below shows.. was this a cause for the pause in equity markets in Q1.. it would appear to be a precursor yes but the relationship is far more quantifiable.
Did a rotation from equities to bonds facilitate the change in market direction? That's nigh on impossible to say but certainly less liquidity means less trades.. less trades means less buys, fund managers like to keep busy - easier to sell some profits to reinvest than play a round of golf (momentum is such a fragile thing).
Q4 buy patterns drew investors to what I would call the 'neutral line' in risk aversion: I suspect the 'neutral' diversification of flows becomes across the asset classes is a reflection of our time and political reflection.. Obama continues to throw down sobering glimpses of the future and investors seem less willing to hold for a record bull run. The current asset mix would indicate that we will see both falls and rises (no fence sitting there then) but over time a steady single digit level of return.
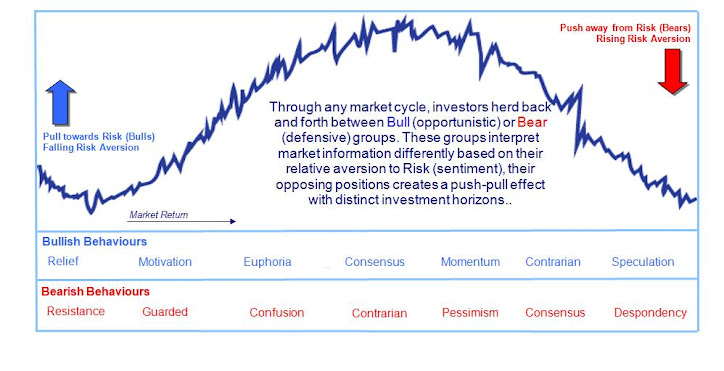
In time of course the market sociology demands a move towards (greed) or away (fear) from risk. These are not necessarily innate inbuilt states but rather forces upon up, peer pressure through media and the fear of not having enough capital to invest for retirement; not enough performance to get that next bonus.. etc
It's all about information volatility and behaviour: much lies in the hands of investors, the media, the pundits and politicians who influence them.
Saturday, 6 February 2010
Waiting for that Dow beta Monday morning in the FTSE - in for a penny!!
Well - that was an interesting couple of days and I'm only now just catching up with the whole hoo-ha. With the FTSE close to 5000 points there is some real opportunity to be had, more than since mid last year. It's a nice time for one of those ViX volatility ETFs but could I find one on HL's site - pah!! Anyway - about 11k ready to be vested for Monday am opening.. (see below)
So, as promised, here are my latest trades - worth noting I have gone both long and shorted (ETF) in the opposing direction, simply because the market could go either way, it's at a funny range where direction is hard to spot (up over next 1-2yrs more likely than not) but where there is good trading range to hedge both ways and cash whichever hits target first and then cash the other when things revert.
The plays being: Venture Capital (private equity looks quite tempting and I can't find Gresham House on HL's site), FTSE 100 both long and short (alas I sold out too early of the first tranche to catch all those nice drops last week), Silver short and leveraged long, Gold long and short (close to SELL point), Vietnam (why not!) and lastly poor old Lloyds - an out and out recovery play - at very least there's about 2.5% of Dow beta coming back to me Monday morning (hopefully) but I'm happy to sit on Lloyds for a few weeks.. the rest will be set to usual targets, one will hit sooner; the other later..!!
After these tranches I'm hoping for some good runs - I'm still playing this too safe, diversified.. next time I cash out I'll start to make bigger single plays - ramp up the risk.
I'll reiterate that I am doing very little research or scoring on these plays - I am using very tight BUY/SELL ranges and buying on pure n simple discount to mean, variance (i.e. thin-spreads minus the bets) The trading costs are low and I retain my asset allocation funds for the long-term (few of which have done much so I feel vindicated with my dabbling!).. be lucky out there..
.jpg)
Thursday, 4 February 2010
Retail Distribution Review - 'the Economy of the Adviser'
An interesting thread on the NMA Linkedin group about 'RDR' (eta 2012), as ever I felt compelled to stir my contrarian spoon. As ever the usual introspective 'why us' responses and amusing inter-IFA bantering.. I chose to take an objective economic view of the situation ;)
http://www.linkedin.com/groupAnswers?viewQuestionAndAnswers=&gid=1961010&discussionID=13014485&commentID=11393782&report%2Esuccess=8ULbKyXO6NDvmoK7o030UNOYGZKrvdhBhypZ_w8EpQrrQI-BBjkmxwkEOwBjLE28YyDIxcyEO7_TA_giuRN#commentID_11393782
Original question: Who will be RDR ready and if not what options are advisers looking for?
[JB wrote]
'Commoditising' any service is first neccessary to finding its likely economic value - the old supply-demand question. It's something the IFA community has avoided for years as it's relied heavily on 2 things 1) convenience - managing various aspects of a client's affairs face to face, for being generalists and 2) polarisation - a 'best advice' carte blanche for IFAs to lead the advisory process and providers to pay their dues in exchange for business.
Connotations are still regularly made between IFAs, solictors and accountants: sectors fairly commoditised [accepted knowledge + time + reputation of firm]. In terms of 'fee based' structures what is the IFA's 'commodity' to charge fees, post-2012?
Consider:
1) Customer A goes to a solicitor for legal advice or to enact legal proceedings - the knowledge applied results in a higher likelihood of success vs. a layman with no knowledge of the law. The likelihood of success is not 100%; since law is a mixture of rules, interpretation or the facts may prohibit success, but the mechanisms of law are fairly certain and so you are confident that you are paying a fee for a reliable level of skill. There is a commodity of known information that incentivises the payment of a fee.
2) Customer B goes to an accountant for tax advice and to put accounts in order ahead of the year-end tax review. Again tax is a prescriptive set of rules, without knowledge of which, the risk of completing the tax return incorrectly or failing to pay the right taxes or take advantage of tax offsets is considered high. Again the commodity of known information is critical to the investor's incentive to avoid undue taxes in exchange for a fee.
3) Customer C goes to a financial advisor or directly to an investment provider -they pay either for an upfront and/or reocurring fee in exchange for best advice, financial planning and/or superior investment strategy. Some may find themselves pay for an online questionnaire or other automated advice tool. The problem is that there is less 'known information' E.g. the likelihood of the adviser guessing a better strategy is largely unpreditable and more and more advisers delegate the investment expertise away.
True - common to all all 3 examples is the lack of absolute g'tees of outcome but investment advice has a wider window of error, covering a longer time-span, there is less known information.
Personally I'm a believer of performance-linked fees, which will alas likely become harder under RDR (since the FSA is devolving product performance from advice; and also killing-off discounts and trail kick-back from the platform/investment providers to the adviser).
Charging fixed fees then needs to be hinged on some sort of specialism: E.g. investment acumen, tax expertise, legacy planning etc. If the incentive to buy is a specialist skill then qualifications are one of the few forms of evidence (the other is word of mouth). If the specialism is an area that is already covered by a recognised profession then the IFA will find it difficult to price above or even par. Investment acumen involves too little margin, too many competitors with more perceived skill. IFAs have never grouped like ARC or APCIMS to validate their past-performance.
So why didn't polarisation work and why is RDR nothing less than a completely new economic model for the IFA? No easy answers but to name a few: a) media - too many IFA customers lost too much money too often b) mis-selling scandals c) political-regulatory reform ala FSMA 2000, d) the devalaution of 'KYC' from low cost alternatives, DAMs and wealth managers, e) the Internet and maybe most suprisingly f) platforms which IFAs helped introduce c.2000!
'So instead of IFAs asking what minimum qualifications they should sit in reaction to RDR - perhaps IFAs should think what commodity they intend to sell, at what level, and what skill customers will expect in exchange for that fee..'
Checklists, hedge funds and human behaviour (Nick Gogerty)
Nick Gogerty posted up an interesting note on the use of 'checklists'.. applicable to choosing active funds, passive etc..
http://nickgogerty.typepad.com/designing_better_futures/2010/01/checklists-hedge-funds-and-human-behaviour.html
It's more developed than my simple logic grid approach; while sharing a similiar ethos, and worth thinking about. Of use to us guys is a re-think on how to diversify a portfolio at outset.
http://nickgogerty.typepad.com/designing_better_futures/2010/01/checklists-hedge-funds-and-human-behaviour.html
"As a hedge fund guy and anthropologist, I am fascinated. Checklist dynamics applied correctly could be a hugely important innovation in group dynamics and increasing human potential. As a tool for facilitating group activity they appear to be incredibly effective. Read the book to understand how they work. It involves, group dynamics, social interactions, reducing cognitive load and a host of other things." Nick Gogerty, Fertilemind Capital
It's more developed than my simple logic grid approach; while sharing a similiar ethos, and worth thinking about. Of use to us guys is a re-think on how to diversify a portfolio at outset.
Wednesday, 3 February 2010
Equity Gold, Energy and Real Estate
Evening fellow sceptics!
Not sure about you guys but Gold is such a bleeding puzzle isn't it - increasingly expensive so you think 'short' but no, it just keeps running and then you fall for the trap and think 'okay maybe I need to swim with the tide a little' and then bam.. prices slide.. Thankfully I lost no more than a few hundred as I did have a short in place but I also got stung on a leveraged Silver ETF that I was using as a spread and geared play of Gold (trying to be too bloody clever more like).. and it serves as a useful reminder to stick to my rules, KISS and buy contrarian..
.bmp)
I've posted up the month on month sales flows into Equity Gold, Energy and RE funds since Jan 2002 until Nov 2009. It's debatable if any discernable pattern is present (perhaps therein is the point.. black swans, black swans..) I've left the 'short' (ETF) in place and bought into RE funds quite early and happy to see how they play out.
Rather than use a dual axis chart; I've deliberately narrowed the axis range to ignore the v.large variances above and below so to focus in on the variances. Let's agree to say that any single monthly flows in excess of >$1.5bn was 'large'..
What I can't get my head round are the macro drivers at play for these 3 sectors.. in the meantime I have regrouped the assets and hived off about 10k to make a new play in my SIPP.. the question now 'is what?'
Subscribe to:
Posts (Atom)
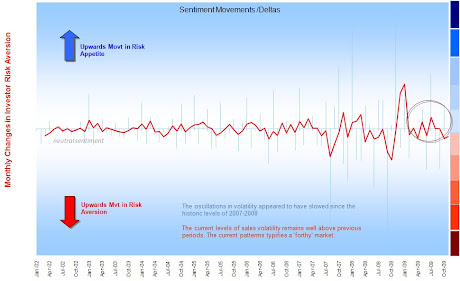
Delta changes in risk aversion (Nov09)
Sentiment: The 'Lag' Effect
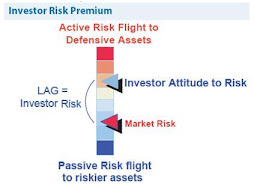
Investor perception of risk is rarely up to date