ETFs as a source of counter-balancing; reduced volatility, increased risk?
E.g. We know Commodity markets are exposed to irregular volatility due to the lack of depth and control of relaitvely few bourses/ market-makers. They are more frequently subject to 'dislocation' the books say.
'Speculators do not drive commodity prices, says OECD' Increased investment in commodities is not linked to the price volatility of the physical commodities themselves, according to a report from the OECD. Not only did the research find index funds did not cause a price bubble in commodity futures, it showed a consistent association between increases in index fund positions and declining volatility.' IPE: Commodity ETFs
But does this mean that ETFs are also capping upside volatility, if so then what unforeseen consequences could this have (E.g. increased risk-taking, increased positions)?
The other danger is one of complacency, to assume the observation is the rule and will remain so. As yet we do not know what changes will occur in the market if the trading volume of ETFs escalates. JB
Monday, 21 June 2010
Structured products.. vs. behavioural economics
Citywire article. An interesting notion. Mundy: overpaying-for-structured?
Investec Asset Management’s star fund manager Alastair Mundy says investors ought to be aware of behavioural economics when buying structured products. He warns investment banks play on the fears of investors and create products that are designed to sell well rather than ones that are appropriate for the market conditions.
A renowned contrarian investor, A-rated Mundy runs approximately £3 billion across a range of funds for Investec. He has been investing via structured products since 2001 and is a self-confessed fan, frequently using them within the Investec Capital Accumulator portfolio.
'Fear and greed' However, Mundy says investment banks will take advantage of behavioural economics, namely the influence of fear and greed, to profit from clients.
He says: ‘I think there is an information advantage that providers have over buyers. There is also an emotional advantage in that buyers are weak and under pressure at times of market turmoil.’
Market sell-offs, Mundy says, are an excellent example of behavioural economics influencing the creation of wrong structured products and investors making wrong choices because everyone – bar the contrarians – is nervous.
He says: ‘Structured products [providers] see volatility is going up and customers are getting scared, so they come up with “capital protected” products with a small amount of upside. They are immediately playing off the fears of investors.
'Therefore, you are immediately running the risk of overpaying for market protection. You can also say you are overpaying for market protection at a wrong time, doing it after a market sell-off rather than before.’
'Bells and whistles' Mundy says the structured products space is a constant battle between manufacturers and consumers.
‘Manufacturers can create all sorts of things with bells and whistles and what they are trying to do is find that coupling of bells and whistles that the customer thinks is best value. The customer has this intuitive idea of what to pay for it, and where that gap is greatest is what allows the manufacturers to sell products in the biggest size.’
He adds: ‘That’s a great challenge every day when buying structured products. You are always in danger of overpaying for the attributes that they see within these products.’
Saturday, 19 June 2010
Active ETFs - does Low Cost offer investors transparecy?
Howdy y'all,
Hope everyone is well on what is a wholly untypical sunny Scottish morning.
To business - lots of chat around active ETFs,
Should we abandon traditional funds for active ETFs, why have ETFs emerged?
Fisrtly there is a sub-topic as to the performance of passive ETFs through the whole economic cycle - we all recall that over say 5 years tracker funds can be left with nil returns if there has been a bull and bear cycle of equal size ('dotcom' was a good example). We also know investors have a habit of selling and buying at the wrong times in the cycle. Few investors stick with a passive fund for 25 years.
Now we have active ETFs coming over from the US, these are the answer they say to addressing the market cycle, presumably that one can switch from passive (beta) to active (alpha or indeed just more beta as is the case) ETFs at the right time in the cycle. Confused, you rightly should be.
The battleground, as I see it, is whether active fund managers should continue to use conventional markets or ETFs to trade. I also wonder what unexpected consequences volumes of active ETFs could have on the market, as they are influencing on the price of broad indices rather than individual positions, subject to increasing automated high speed trading.
Also, in the UK, I scratch my head to gauge the superiority (other than price) for active ETFs over closed-ended quoted Investment Trusts.. I recognise these are not US-based but they have sold in the US to the Instl market. The difference is that ITS are also governed by trustees. The other is that Trusts can run at a discount or premium to NAV, ETFs should be reflective of NAV.
In some ways active ETFs could be sold on the basis of low cost; granted, but at the sake of investment transparency, which is the main draw of passive (index based) ETFs. I have not fully resolved this myself and put out for discussion.
JB
Hope everyone is well on what is a wholly untypical sunny Scottish morning.
To business - lots of chat around active ETFs,
Should we abandon traditional funds for active ETFs, why have ETFs emerged?
Fisrtly there is a sub-topic as to the performance of passive ETFs through the whole economic cycle - we all recall that over say 5 years tracker funds can be left with nil returns if there has been a bull and bear cycle of equal size ('dotcom' was a good example). We also know investors have a habit of selling and buying at the wrong times in the cycle. Few investors stick with a passive fund for 25 years.
Now we have active ETFs coming over from the US, these are the answer they say to addressing the market cycle, presumably that one can switch from passive (beta) to active (alpha or indeed just more beta as is the case) ETFs at the right time in the cycle. Confused, you rightly should be.
In my ETF guide I talked about the different phases of a market cycle - ETFs do best in the early phase of a bull run where growth is largely driven at a macro level and then lose ground to active managers who assume risks above market to outperform.I think the interesting dynamic is whether traditional active managed collective models (mutual funds) are flawed from outset, expensive and opaque to the investor. I have certainly written on a number of occassions, challenging the investment return of fund managers and their revenue models. In which case do ETFs offer a new model for any investment OR should ETFs remain in passive strategies?
The battleground, as I see it, is whether active fund managers should continue to use conventional markets or ETFs to trade. I also wonder what unexpected consequences volumes of active ETFs could have on the market, as they are influencing on the price of broad indices rather than individual positions, subject to increasing automated high speed trading.
Also, in the UK, I scratch my head to gauge the superiority (other than price) for active ETFs over closed-ended quoted Investment Trusts.. I recognise these are not US-based but they have sold in the US to the Instl market. The difference is that ITS are also governed by trustees. The other is that Trusts can run at a discount or premium to NAV, ETFs should be reflective of NAV.
In some ways active ETFs could be sold on the basis of low cost; granted, but at the sake of investment transparency, which is the main draw of passive (index based) ETFs. I have not fully resolved this myself and put out for discussion.
JB
Subscribe to:
Posts (Atom)
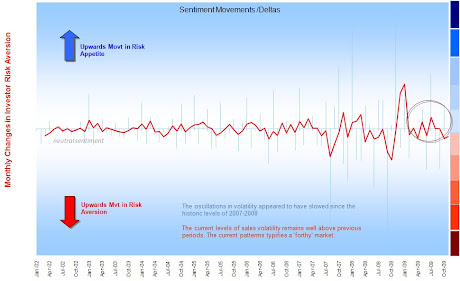
Delta changes in risk aversion (Nov09)
Sentiment: The 'Lag' Effect
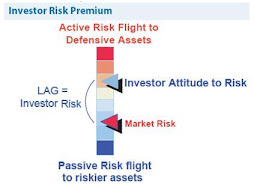
Investor perception of risk is rarely up to date