Sunday 16 October 2011

An honest account.. thank goodness no Black Swans..!!

Thank goodness the mainstream UK punter has yet to cotton (like the Mandlebrot ref there) onto Taleb lest they be screaming 'Black Swans' .. 'Black Swans' 24/7...


Does the power of herding have the power to move markets? An honest account of a simple fund analyst, left with unanswered questions in the wake of 2008.

Herding: Does money drives markets; drive money?
Back in 2007 I was a fund analyst for a large global investment house charged to try and make sense of fund markets when the credit market ‘crunched’. By the start of 2009 I was on garden leave; reeling from the simple fact that my company had lost 40% of its assets and 70% of its new sales in a very short space of time.

At the time I was trained to believe that markets and economics should run efficiently; the emphasis being on SHOULD. Many believed that investor patterns were wholly entropic (both random and unpredictable) and perhaps that is still partly true but what if they are also sociological, groups of investors following  similar influences from one asset class to another?
Beyond physical events; investment risk is popularly regarded as man-made. If true then it is likely to stem from: Psychology (irrationality and market abuse), Sociology (politics and media) and Technology (access and speed).

Market Cycles: The Absurdity of the Traditional Model.
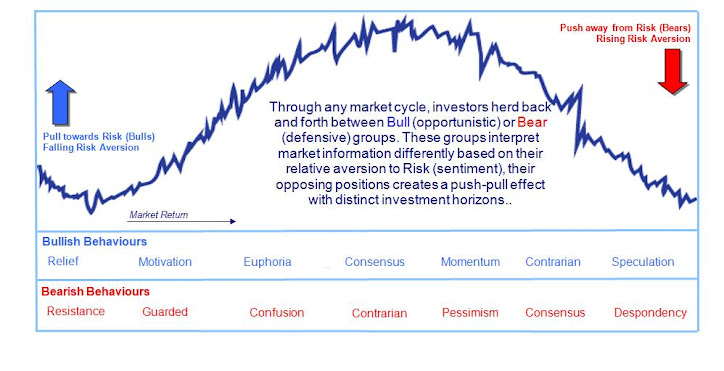
Behavioural finance scholars have long highlighted a simple fact:  that the fear of being wrong; and losing capital, is stronger than the ambition of beating the market. Meanwhile textbooks drive home the sanctity of an investor’s ‘utility’ (their appetite for risk). However investor actions in the market attest to group-think, where investors overestimate or underestimate their own attitude to risk. When that happens then they stop acting as individuals and they begin to herd.

Markets (and investors) remain obsessed about whether they are in a rising or falling market. These markets became widely known as 'bull' and 'bear' cycles and as high a motivator of investor behaviour as you will find anywhere. Traditionally if this concept holds then we should expect distinct bull and bear markets, they are familiar terms, straightforward and cast the 'bear' as the villain profit-taker and the bull as the hero profit maker. However what if I told you that there is never a clear bull or bear consensus; rather one huge tug-o-war between pundits, prophets and politicians? Investors are subjected to influence to herd towards one argument or the other; it is self-fulfilling that herding then creates the outcome.

Group Think: Are Investors Victims of their own Irrationality?
Market commentators often depict investors as hapless market passengers and many investors will concur. However individualism and herding is shortening the market cycle as investors put greater focus on short-term information over their long-term asset allocation. By doing so they compromise the very allocation designed to meet their needs. Group think is not solely confined to investments of course; it is the queue of traffic in the outside lane of a motorway when the inside lane flows freely; it was the bank run on Northern Rock. Here my interest in group think lies in fund flow herding.


2008-2010: Bond or Bust?
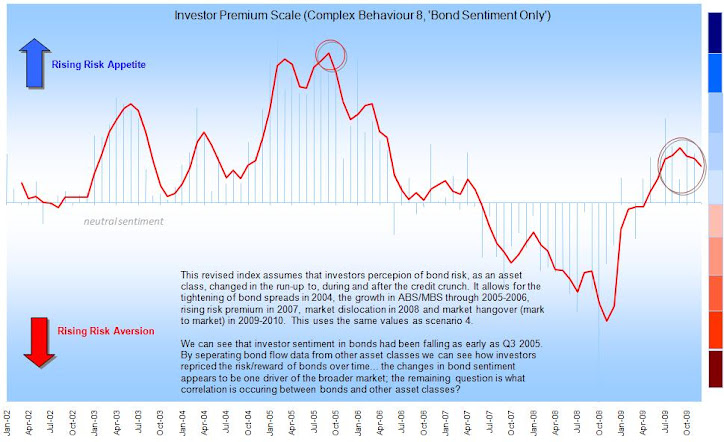
By building samples of fund sales flows I began to chart how investors reacted to different situations, the effect on their attitude to risk and how those patterns changed. Unsurprisingly I will mention the unprecedented drop in confidence through 2008; and the somewhat premature rebound through 2009. Interestingly that recovery in buying patterns by January 2009 pre-dated the market recovery by about 3 months. Buying confidence again fell in October 2009 as the risk of a ‘double-dip’ appeared about 'evens ' with the likelihood of sentiment picking back up.

A key factor during the credit crunch was investors re-pricing the risk in bond markets and its exposure across other asset classes. We called it ‘contagion’ and it displayed viral-like qualities. However sentiment towards bonds had been declining as far back as 2005.

2010-2011: Absolute Uncertainty!
Through 2009-2011 inflows into new absolute return and strategic bond funds grew dramatically. At the same time; despite poor economic outlooks, traditional ‘flight’ sectors such as UK Gilts remained relatively flat. It is now clearer to me that [rightly or wrongly] absolute return and strategic bond funds had become the new ‘uncertainty’ safe havens.

As far back as May 2011 Morningstar flagged a ‘silent crash’ among US fund investors; soon after other agencies were flagging similar dissent across European markets. Outflows and mass retreat into defensive assets appear to have predated the market crash in August-September. The reason may be simple, if every fund manager had to redeem £1 for every £3 invested then their position quickly becomes stretched. At some point the manager may feel compelled to rebalance risk or to liquidate to cover redemptions. Neither outcome promotes a rising index.
If you cross-reference sentiment indicators such as John Gilbert (JGFR) then it’s clear that investors never actually regained confidence; merely they found new ways to invest their growing anxiety.

Conclusions for the Future.

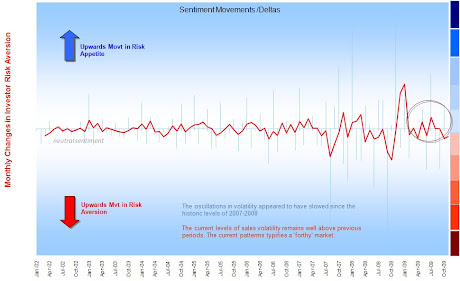
Despite the persistent inflows; into mixed asset funds through 2009-2011, I cannot see an end to growing individualism among fund buying. If we look at the month-on-month changes in fund flow patterns and risk aversion (‘deltas’) then we can that the magnitude of herding has grown steadily and the swing from positive to negative sentiment has quickened.
Why? My reasoning is simple in that fund investing; and the technology surrounding it, is becoming more accessible and faster. Absolute return and life-styling products slowed this trend in 2010 but the risk of disillusioned investors hangs over these sectors. At the time of writing, rising UK inflation may form a key risk for such strategies.

Long-term; as the traditional fabric of company pensions and advisory process fragments, then even greater levels of media influence and herding lie ahead. The current market is ill-equipped for such irrationality, from literally millions of investors, which puts further pressure on already creaky asset allocation models anchored on historical market returns.


Saturday 6 August 2011

S&P downgrade of US Govt credit rating.. A question of ethics?!

Although I do worry on the downstream effects of the US downgrade itself..

A debtor that hasn't defaulted is not the same as one with no default risk.

We look at the US balances and question if paying debt with another debt is sound practice. The reality is that we have treated US debt as one big blank check and that has capitalised debt down the US food chain into GSEs, Muni etc. It it marks the divide between US and the rest of the world: the level of arrogance, patriotism and naivety of the US never cease to astound!

Also I saw no intervention re S&P ratings at the tme in a Market well reported as early as 2006. As part analysts, part auditors, part media they were victims like many of us. We cannot now disparage their conservatism after having criticised their earlier liberalism. Alas I think politics will come to bare but this remains a point of independence and S&Ps status as a credible global agency not a US puppet!

On the eve of an election year, Capital hill has played political games with the global economy
Quote of the day: "Great spirits have always found violent opposition from mediocrities. The latter cannot understand it when a man does not thoughtlessly submit to hereditary prejudices but honestly and courageously uses his intelligence." Albert Einstein (attributed)

Investment U


Delta changes in risk aversion (Nov09)

Sentiment: The 'Lag' Effect

Sentiment: The 'Lag' Effect
Investor perception of risk is rarely up to date

Global Consciousness Project (GCP) 'Dot'

The Global Consciousness Project collects random numbers from around the world. This is a real time data analysis of the GCP. It collects the data each minute and runs statistics on the stream of random numbers generated by the project. This analysis is run 10 minutes behind the generation of the data. In this way, it can be seen as a real-time indicator of global consciousness coherence. http://gcp.djbradanderson.com/ BLUE DOT: Significantly small network variance. Suggestive of deeply shared, internally motivated group focus. The index is above 95% BLUE-GREEN DOT: Small network variance. Probably chance fluctuation. The index is between 90% and 95% GREEN DOT: Normally random network variance. This is average or expected behavior. The index is between 40% and 90% YELLOW DOT: Slightly increased network variance. Probably chance fluctuation. The index is between 10% and 40% AMBER DOT: Strongly increased network variance. May be chance fluctuation, with the index between 5% and 10% RED DOT: Significantly large network variance. Suggests broadly shared coherence of thought and emotion. The index is less than 5% The probability time window is one hour. For a more information on the algorithm you can read about it on the GCP Basic Science page

Choosing Mutual Funds..

Choosing a Mutual Fund – CLUE “it is not about past performance.." You could try - Logic Scoring! The trick is to create your own metrics and populate them into your own grid.. Always remember to test your assumptions v outcomes: your model may be right but you may find what you thought to be a SELL is actually a BUY. Always look at the problem in the mirror! You can also read this in conjunction with my guide on Value at Risk and other Key Risk Indicators below. http://tinyurl.com/ydvf3zh

Bull versus Bear Investing; versus Herding

The lifecycle (or holding period) of an investment held by a particular investor, often categorised as short, medium or long-term.

Let's get normal volatility out of the way first.. VaR-based toolkit.

Ok - a starting point - let's get normal volatility out of the way first.. This pack was written around end Q308 - post 16/8 but before the massive movement of Oct-Nov08. For those who support brownian motion or the geometric movement of returns then, I'm afraid to say, it's going to end bad..

What is the fuss with volatility.....

Re the movement of market returns - many believe they follow a geometric or exponential Brownian motion ('GBM') which is a continuous-time stochastic process in which the logarithm of the randomly varying quantity follows a Brownian motion, also called a Wiener process. It is used particularly in the field of option pricing because a quantity that follows a GBM may take any positive value, and only the fractional changes of the random variate are significant ('deltas').

http://en.wikipedia.org/wiki/Geometric_Brownian_motion


So in practice 'brownian motion' assumes a strong tendency to trend - it says that returns won't jump from day 1 to day 2 but move up and down in fairly predictable increments.. the returns of the previous days have an impact on the subsequent day - they are not unique. This estimation of how prices move is the underlying principal for the future pricing of derivatives contracts such as options.. i.e. E.g. to buy a contract, at one price, to buy or sell the underlying asset at a future date at a future price... this is usually referred to as the 'Black-Scholes formula' or the much much earlier Bronzin model (1908). This ties up with the old-age 'law of big numbers' (or law of averages) - where returns follow a pattern around a mean and that the volatility around that mean diminishes over time.. Where those returns are then assumed to form a normal distribution (or bell curve) then the 'GBM' is symmetrical to the mean of those returns. BUT what if we do not believe upside and downside returns will be similiar?.
A LOT of analysis has been run since to dispel this view such as many variations of the the Noble winner Robert Engle's ARCH approach in 2003 ('heteroskedasticity'.. or the analysis of different dispersions/volatilities), countless variations thereof, stochastic models (see below*), extreme loss analysis, stress testing, scenario analysis and so on - it keeps the Math boys busy shall we say...

*Stochastic models: treat the underlying security's volatility as a random process, governed by variables such as the price level of the underlying, the tendency of volatility to revert to some long-run mean value, and the variance of the volatility process itself, among others. Somtimes I use Markov chain as the easiest way to visualise and understand a random process: usually it's illustrated by the cat and the mouse:

Suppose you have a timer and a row of five adjacent boxes, with a cat in the first box and a mouse in the fifth one at time zero. The cat and the mouse both jump to a random adjacent box when the timer advances. E.g. if the cat is in the second box and the mouse in the fourth one, the probability is one fourth that the cat will be in the first box and the mouse in the fifth after the timer advances. When the timer advances again, the probability is one that the cat is in box two and the mouse in box four. The cat eats the mouse if both end up in the same box, at which time the game ends. The random variable K gives the number of time steps the mouse stays in the game..

This Markov chain then has 5 states:

State 1: cat in the first box, mouse in the third box: (1, 3)
State 2: cat in the first box, mouse in the fifth box: (1, 5)
State 3: cat in the second box, mouse in the fourth box: (2, 4)
State 4: cat in the third box, mouse in the fifth box: (3, 5)
State 5: the cat ate the mouse and the game ended: F.

To show this for a fairly infinite number of price movements is somewhat less achievable but nonetheless that's what the clever bods have done..

Otherwise most of probability, I admit, is above my head unless it descends into some sort of practical application - BUT I get the sub-plot.. stop trying to predict future patterns from regressing past performance... show me the track record of a model (after it has been created) and I'll be one step closer to being converted.. I'll touch on stress testing, extreme analysis ('extremistan') and scenarios another day..

"The Black–Scholes model disagrees with reality in a number of ways, some significant. It is widely employed as a useful approximation, but proper application requires understanding its limitations -blindly following the model exposes the user to unexpected risk. In short, while in the Black–Scholes model one can perfectly hedge options by simply Delta hedging, in practice there are many other sources of risk." Wikpedia

http://en.wikipedia.org/wiki/Black%E2%80%93Scholes


Active-Passive Investing Debate

Performance Patterns: **This deck is based on some work-based research so apologies for the confusing arguments - as a consequence the 'story' in the slides is a little muddy so I will re-jig this in the New Year to make my points clearer.** Passive-active purchase drivers in the UK are less differentiated/defined than perhaps elsewhere; the basic rules apply: What I did find was that there were interesting herding flows preceding, into and of the credit crunch. These were large asset-class movements: something which active managers would have little control of unless they ran absolute return type startegies. What my analysis showed is that an investor could manage a passive portfolio tactically to take advantage of large herding patterns. This involves risk, access to the right data, practice and above all discipline but I hope it will be a journey we can share!!

Lessons for 2010 - REIT Funds

Noting the events around 2005-2008 make for interesting considerations when thinking about buying REIT Funds in 2010..

The UK Investor - The Surprise Factor

The maps in the presentation (below) really help illustrate the suprise factor of the credit crunch.. little of the previous patterns would prepare the UK investor for what was about to come. The flows show that investors did not recognise the risks inherent in 2006-2008. This is because the industry uses conventional fund metrics, which were at best outputs not guides..!

The UK Investor - IMA 'Map' 2002-2008

Jon Beckett, ASCI - Past Projects (2003-2008)

I have been involved in the IFA and investment market since 1998, covering a broad range of roles. I have engaged a number of industry bodies over the years, to be a voice for change, to reform our industry and make it trusted and respected. None of the projects shown should be related to Franklin Templeton either: explicit, inferred or otherwise. I attach some of my past projects from 2004-2008.. Rgds JB