'Future of the Banking sector'
A most enjoyable macro session by Bill Jamieson (Exec Ed Scotsman newspaper) at the Carlton hotel last Tuesday night..
As Bill would aptly pontificate about any debt-driven double dip: waiting for 'the shoe to fall off the other foot', perhaps S&P is getting into the shoe business given it's fervour to unsettle the market through a series of sovy downgrades, let's just hope it's sized the feet correctly lest we suffer discomfort? We wouldn't want the financial equivalent of bunions now would we!
When will credit agencies like S&P come under full regulation, they seem to swing from inertia to over-exuberance, dangerous traits in a media driven world.
Bill rightly points to the capricious nature of events yet to unfold..
Wednesday, 28 April 2010
Sunday, 25 April 2010
A History of Modern Portfolio Theory: i.e. chasing the ‘Holy Grail’
As fund analysts we are often derided as the ‘blunt end of the stick’ when it comes to the tricky numbers. In the last decade we have seen an explosion in models to calculate the risk of financial instruments. 2 things are true of these advances in financial analysis: 1) they became more complex and mathematical and 2) they failed to reduce the level of risk for the investor: think LTCM, Black Monday (19/10/1987) , Barings-Asia crisis (97), dot-com (2000) and the credit crunch (2008).

1950s: Optimization (Markowitz)
1960s: Capital Asset Pricing (Treynor, Sharpe etc)
1970s: Attribution (SIA UK)
1970s: Arbitrage Pricing Theory (Ross)
1980s: Heuristics and behavior (Kahneman & Tversky)
1990s: Stochastic (Wiener, Black, Scholes, Merton)
1990s: Rise of Value at Risk based models (VaR)
2000s: Asset-liability strategies (ALM, aka LDI)
2000s: Fluid dynamic models (Navier-Stokes)
2000s: ARCH-based models (Engle)
There is no holy grail in predicting future financial markets from the price movement of previous ones..
"Any intelligent fool can make things bigger and more complex... It takes a touch of genius - and a lot of courage to move in the opposite direction." Albert Einstein

1950s: Optimization (Markowitz)
1960s: Capital Asset Pricing (Treynor, Sharpe etc)
1970s: Attribution (SIA UK)
1970s: Arbitrage Pricing Theory (Ross)
1980s: Heuristics and behavior (Kahneman & Tversky)
1990s: Stochastic (Wiener, Black, Scholes, Merton)
1990s: Rise of Value at Risk based models (VaR)
2000s: Asset-liability strategies (ALM, aka LDI)
2000s: Fluid dynamic models (Navier-Stokes)
2000s: ARCH-based models (Engle)
2000s: Levy-jump models and power laws (LSE
2000s: Chaos theory, entropy (Lorenz)
2000s: Extreme Value models, organic (ongoing)
2000s: Extreme Value models, organic (ongoing)
There is no holy grail in predicting future financial markets from the price movement of previous ones..
Clown thinking.. Investor Herding as a by-product of Media Influence?
A large part of my research has identified but failed to measure the impact of mass media and media influence and how they integrate with the behavioural system that is investor herding and market returns. In going back to my sociology roots I'll try and examine the financial problem from a socio-economic perspective (hey, I tried working it out from a financial perspective and it didn't work!!).
BUT why should we be conerned with media influence? - because we have become de-instituionalised 24/7 media/online culture. Media influence is becoming more pervasive as investors are empowered by the transition from advised to DIY investing and the large institutionalised (pension scheme) money is being devolved back to the individual as regulatory reforms grip.
The concept of tomorrow's investment market being some sort of hive of millions of individual thoughts, influenced by media and traded by dealers with ever advancing and accelerating trading systems is a shuddering one. Outcomes look set to become more uncertain, volatility swings more behavioural and past regressions even less indicative.
Media influence in short is 'refer to the theories about the ways the mass media affect how their audiences think and behave. Mass media plays a crucial role in forming and reflecting public opinion, connecting the world to individuals and reproducing the self-image of society. Critiques in the early-to-mid twentieth century suggested that media weaken or delimit the individual's capacity to act autonomously' http://en.wikipedia.org/wiki/Media_influence
BUT why should we be conerned with media influence? - because we have become de-instituionalised 24/7 media/online culture. Media influence is becoming more pervasive as investors are empowered by the transition from advised to DIY investing and the large institutionalised (pension scheme) money is being devolved back to the individual as regulatory reforms grip.
The concept of tomorrow's investment market being some sort of hive of millions of individual thoughts, influenced by media and traded by dealers with ever advancing and accelerating trading systems is a shuddering one. Outcomes look set to become more uncertain, volatility swings more behavioural and past regressions even less indicative.
Friday, 23 April 2010
Suspend all notions of regression analysis?
It would appear, as an industry, that we answer the fundamental questions with a cumulation of models: each the answer to the predecessor. It's like saying how do we fix stochastic forecasting by improving regression.. you can't... we can simply throw more estimates at a problem or fewer. We're chasing a holy grail that's become more elusive as the system becomes more 'efficient' and faster (HFT).
To quote you: "if you do not use statistics measures (such as VaR), how do you take care of your clients' potential downside?”
: the answer, in its purest sense, is that we do not expose clients to downside risk.. period.. now if that's the starting point where would one go, as 'experts' to achieve that? Not a ponzi scheme before anyone jumps in.
I am only asking us, just for a moment, to suspend all notions of regression analysis; to assume that it has no bearing on the future returns of your client investments.. that the fact it on occassion it appears to explain what is happening in price returns is fallacy, mostly coincidence, behavioural and only very rarely brownian... then what would you do, where would you start? Where indeed.
JB
A Brave Path: Risk inherently can't be measured?
A good point cropped up on the mother of threads on the wealth forums:
JB: Does Correlation/Regression work? Perhaps the 'rules' between asset classes themselves are simple behavioural conventions.. we saw during periods of dislocation that (investors) money can quickly forget efficiency and correlation, which perhaps exposes that there are no rules; only human perceptions of what is high and low risk in a given set of conditions over a given expected investment horizon..
We also see the gap between expected risk and actual risk hit new levels, which infers that regression and stochastic-based approaches are fragile.
I pose that risk is blind of asset class unless there is some anchor of return, which isn't overly dependent on counter-party risk to achieve it.. risk only gets shoved around or swept under the carpet; it rarely goes away. This would infer investing outside of the conventional approach, to buy based on behavioural (empirical) conditions..
I have no hard and fast solution and building a portfolio for resilience grounds is challenging indeed.
A brave path.
"I'm a newbie to all of this, and have been following along since this topic's inception. I would have to go with risk inherently can't be measured. Obviously. But a model for it can be built in order to hedge against excessive unnecessary risk. In a perfect world putting competing instruments in the same portfolio based on the level of risk the client is willing to take on. However, sometimes both of them go south and you're left flailing in the wind.
In my personal investment portfolio, I like to couple things that are inverse to one another while still giving one an advantage (stocks to bonds, currency to commodities) and of course taking at least 2-5 long positions in a reputable mutual fund. May not be the best way to go about it, but it works and I still earn a pretty reasonable return when inflation is calculated in. "
JB: Does Correlation/Regression work? Perhaps the 'rules' between asset classes themselves are simple behavioural conventions.. we saw during periods of dislocation that (investors) money can quickly forget efficiency and correlation, which perhaps exposes that there are no rules; only human perceptions of what is high and low risk in a given set of conditions over a given expected investment horizon..
We also see the gap between expected risk and actual risk hit new levels, which infers that regression and stochastic-based approaches are fragile.
I pose that risk is blind of asset class unless there is some anchor of return, which isn't overly dependent on counter-party risk to achieve it.. risk only gets shoved around or swept under the carpet; it rarely goes away. This would infer investing outside of the conventional approach, to buy based on behavioural (empirical) conditions..
I have no hard and fast solution and building a portfolio for resilience grounds is challenging indeed.
A brave path.
Sunday, 18 April 2010
My note to Alex Salmond.. 'Greedy Bankers'?!
My note to SNP HQ.. following the attached election flyer that came through my door.. I felt the urge to send my First Minister a quick note to share thoughts.. I entitle my email 'Potential Vote Loser'!!
FAO: Rht Hon. Mr Alex Salmond, First Minister of Scotland
.jpg)
FAO: Rht Hon. Mr Alex Salmond, First Minister of Scotland
Dear First Minister (Alex),
As a long-term SNP supporter (voting) I wanted to draw your attention to the attached:
Scotland's heritage as a banking and financial nation cannot; should not, be down-played or derided. Why then are your local candidates playing such an obvious media-invested 'Greedy Bankers' card? Such tactics do little to effect the financial square mile of London: the well protected traders and high-flyers but does impact the average bank worker: each time they pick up a tabloid, switch on the 6 o'clock news, panel debate or every sensationalised right to reply programme. Nor, if my geography serves, do they fall into any constituency you are campaigning.
'Make the Greedy Bankers Pay Not the People - Say SNP' Ignoring Mr McNally's and Mr Smith's somewhat flawed argument vis a vis Treasury earnings derived from said bonuses; their subsequent decline and deficit and the likely return we (as taxpayers) will see from mark-market bank assets via GAPS over the next 5 years:
The media has deliberately (for whatever reason or agenda) chosen not to differentiate the average bank worker from the so-dubbed 'fat cats'. I suspect fewer than 1% of the financial workers in Scotland are eligible to the fabled high risk bonuses; and we know many earn below the UK's avg wage. I have come to expect the UK parties to take full advantage of such easy collateral but why would Scotland's party do the same, since the reputational damage is greatest on Scotland?
My wife, who has also voted SNP in the past, took great offence. She is no city banker but worked hard for RBS for 16 years, to rise through the ranks and earn her money. She did not cause the credit crunch, did not work on the asset-banking side but has had to deal with much of the fall-out: redundancies, restructures. To say she has taken an emotional battering is an understatement, like many she would love nothing more than to now leave the banking sector for good!
I myself a hard working financial analyst who lost his job in 2009; (a result of US repartionation of jobs at my firm) 1 day after Obama's inauguration! Again I would never have qualified as a 'city banker'. In fact my work was aimed at identifying risks, improving investor information and setting controls when/where possible, having worked my way up through the ranks over 10 long years.
Alas when this insult to Scotland arrived through our letterbox SNP's vote; your vote, in this household (at least), went from 2 to 1 (at best)!
If nothing else (being sth of a strategist) using such a tactic in a heavy Edinburgh-Glasgow commuter belt is at best naive; frustrating when the sub-text of their second point ('expenses') was valid if not properly played through, which infers some weakness in that claim. Alas the headline merely casts your candidates as poorly informed regarding the economy, financial regulation and the hitherto reasons why we are facing unwanted but necessary taxation rises.
Mr Salmond, you have a real opportunity to take the high ground in this election: to call a spade a spade and defend Scottish bankers. Mistakes were made by the few; mistakes were made globally, but few suffered the public back-lash so much as Scottish bank workers. Please don't blow it by allowing your party to follow the herd, by pandering to the media-drunk middle-England, blaming the wrong people and disheartening so many 000s of banking workers in Scotland; not to mention the 000s more in associated investment, wealth and pension sectors.. our nation's heritage! It is likely we will see a new party into #10 in May; time then for a strong Scottish Executive, a strong First Minister and a strong effort to rebuild our financial reputation in the UK, and globally.
Undoubtedly you will be a busy man, with both ministerial tasks and impending election, but appreciate your response as to why this household should still give SNP at least 1 vote at the next GE?
With sincerity and regards
Jon Beckett, BA, ACSI
.jpg)
Subscribe to:
Posts (Atom)
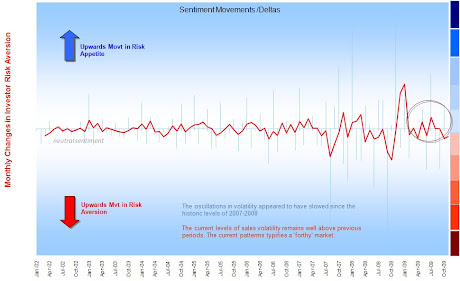
Delta changes in risk aversion (Nov09)
Sentiment: The 'Lag' Effect
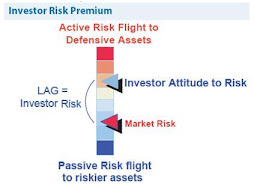
Investor perception of risk is rarely up to date