Retail Distribution Review - 'the Economy of the Adviser'
An interesting thread on the NMA Linkedin group about 'RDR' (eta 2012), as ever I felt compelled to stir my contrarian spoon. As ever the usual introspective 'why us' responses and amusing inter-IFA bantering.. I chose to take an objective economic view of the situation ;)
http://www.linkedin.com/groupAnswers?viewQuestionAndAnswers=&gid=1961010&discussionID=13014485&commentID=11393782&report%2Esuccess=8ULbKyXO6NDvmoK7o030UNOYGZKrvdhBhypZ_w8EpQrrQI-BBjkmxwkEOwBjLE28YyDIxcyEO7_TA_giuRN#commentID_11393782
Original question: Who will be RDR ready and if not what options are advisers looking for?
[JB wrote]
'Commoditising' any service is first neccessary to finding its likely economic value - the old supply-demand question. It's something the IFA community has avoided for years as it's relied heavily on 2 things 1) convenience - managing various aspects of a client's affairs face to face, for being generalists and 2) polarisation - a 'best advice' carte blanche for IFAs to lead the advisory process and providers to pay their dues in exchange for business.
Connotations are still regularly made between IFAs, solictors and accountants: sectors fairly commoditised [accepted knowledge + time + reputation of firm]. In terms of 'fee based' structures what is the IFA's 'commodity' to charge fees, post-2012?
Consider:
1) Customer A goes to a solicitor for legal advice or to enact legal proceedings - the knowledge applied results in a higher likelihood of success vs. a layman with no knowledge of the law. The likelihood of success is not 100%; since law is a mixture of rules, interpretation or the facts may prohibit success, but the mechanisms of law are fairly certain and so you are confident that you are paying a fee for a reliable level of skill. There is a commodity of known information that incentivises the payment of a fee.
2) Customer B goes to an accountant for tax advice and to put accounts in order ahead of the year-end tax review. Again tax is a prescriptive set of rules, without knowledge of which, the risk of completing the tax return incorrectly or failing to pay the right taxes or take advantage of tax offsets is considered high. Again the commodity of known information is critical to the investor's incentive to avoid undue taxes in exchange for a fee.
3) Customer C goes to a financial advisor or directly to an investment provider -they pay either for an upfront and/or reocurring fee in exchange for best advice, financial planning and/or superior investment strategy. Some may find themselves pay for an online questionnaire or other automated advice tool. The problem is that there is less 'known information' E.g. the likelihood of the adviser guessing a better strategy is largely unpreditable and more and more advisers delegate the investment expertise away.
True - common to all all 3 examples is the lack of absolute g'tees of outcome but investment advice has a wider window of error, covering a longer time-span, there is less known information.
Personally I'm a believer of performance-linked fees, which will alas likely become harder under RDR (since the FSA is devolving product performance from advice; and also killing-off discounts and trail kick-back from the platform/investment providers to the adviser).
Charging fixed fees then needs to be hinged on some sort of specialism: E.g. investment acumen, tax expertise, legacy planning etc. If the incentive to buy is a specialist skill then qualifications are one of the few forms of evidence (the other is word of mouth). If the specialism is an area that is already covered by a recognised profession then the IFA will find it difficult to price above or even par. Investment acumen involves too little margin, too many competitors with more perceived skill. IFAs have never grouped like ARC or APCIMS to validate their past-performance.
So why didn't polarisation work and why is RDR nothing less than a completely new economic model for the IFA? No easy answers but to name a few: a) media - too many IFA customers lost too much money too often b) mis-selling scandals c) political-regulatory reform ala FSMA 2000, d) the devalaution of 'KYC' from low cost alternatives, DAMs and wealth managers, e) the Internet and maybe most suprisingly f) platforms which IFAs helped introduce c.2000!
'So instead of IFAs asking what minimum qualifications they should sit in reaction to RDR - perhaps IFAs should think what commodity they intend to sell, at what level, and what skill customers will expect in exchange for that fee..'
Quote of the day: "Great spirits have always found violent opposition from mediocrities. The latter cannot understand it when a man does not thoughtlessly submit to hereditary prejudices but honestly and courageously uses his intelligence." Albert Einstein (attributed)
What is the fuss with volatility.....
Re the movement of market returns - many believe they follow a geometric or exponential Brownian motion ('GBM') which is a continuous-time stochastic process in which the logarithm of the randomly varying quantity follows a Brownian motion, also called a Wiener process. It is used particularly in the field of option pricing because a quantity that follows a GBM may take any positive value, and only the fractional changes of the random variate are significant ('deltas').
http://en.wikipedia.org/wiki/Geometric_Brownian_motion
So in practice 'brownian motion' assumes a strong tendency to trend - it says that returns won't jump from day 1 to day 2 but move up and down in fairly predictable increments.. the returns of the previous days have an impact on the subsequent day - they are not unique. This estimation of how prices move is the underlying principal for the future pricing of derivatives contracts such as options.. i.e. E.g. to buy a contract, at one price, to buy or sell the underlying asset at a future date at a future price... this is usually referred to as the 'Black-Scholes formula' or the much much earlier Bronzin model (1908). This ties up with the old-age 'law of big numbers' (or law of averages) - where returns follow a pattern around a mean and that the volatility around that mean diminishes over time.. Where those returns are then assumed to form a normal distribution (or bell curve) then the 'GBM' is symmetrical to the mean of those returns. BUT what if we do not believe upside and downside returns will be similiar?.
A LOT of analysis has been run since to dispel this view such as many variations of the the Noble winner Robert Engle's ARCH approach in 2003 ('heteroskedasticity'.. or the analysis of different dispersions/volatilities), countless variations thereof, stochastic models (see below*), extreme loss analysis, stress testing, scenario analysis and so on - it keeps the Math boys busy shall we say...
*Stochastic models: treat the underlying security's volatility as a random process, governed by variables such as the price level of the underlying, the tendency of volatility to revert to some long-run mean value, and the variance of the volatility process itself, among others. Somtimes I use Markov chain as the easiest way to visualise and understand a random process: usually it's illustrated by the cat and the mouse:
Suppose you have a timer and a row of five adjacent boxes, with a cat in the first box and a mouse in the fifth one at time zero. The cat and the mouse both jump to a random adjacent box when the timer advances. E.g. if the cat is in the second box and the mouse in the fourth one, the probability is one fourth that the cat will be in the first box and the mouse in the fifth after the timer advances. When the timer advances again, the probability is one that the cat is in box two and the mouse in box four. The cat eats the mouse if both end up in the same box, at which time the game ends. The random variable K gives the number of time steps the mouse stays in the game..
This
Markov chain then has 5 states:
State 1: cat in the first box, mouse in the third box: (1, 3)
State 2: cat in the first box, mouse in the fifth box: (1, 5)
State 3: cat in the second box, mouse in the fourth box: (2, 4)
State 4: cat in the third box, mouse in the fifth box: (3, 5)
State 5: the cat ate the mouse and the game ended: F.
To show this for a fairly infinite number of price movements is somewhat less achievable but nonetheless that's what the clever bods have done..
Otherwise most of probability, I admit, is above my head unless it descends into some sort of practical application - BUT I get the sub-plot.. stop trying to predict future patterns from regressing past performance... show me the track record of a model (after it has been created) and I'll be one step closer to being converted.. I'll touch on stress testing, extreme analysis ('extremistan') and scenarios another day..
"The Black–Scholes model disagrees with reality in a number of ways, some significant. It is widely employed as a useful approximation, but proper application requires understanding its limitations -blindly following the model exposes the user to unexpected risk. In short, while in the Black–Scholes model one can perfectly hedge options by simply Delta hedging, in practice there are many other sources of risk." Wikpedia
http://en.wikipedia.org/wiki/Black%E2%80%93Scholes
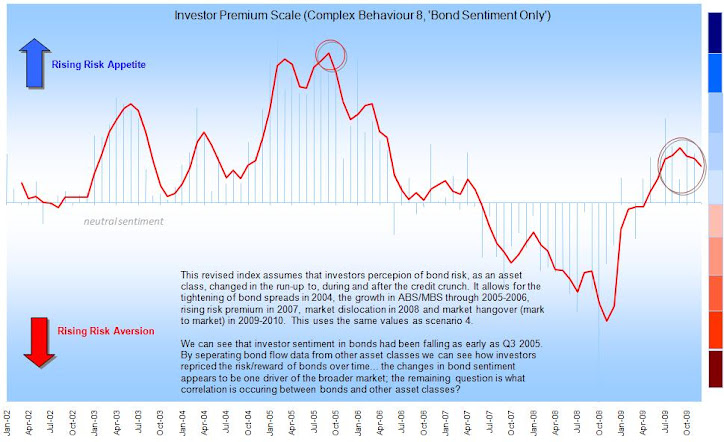
The UK Investor - The Surprise Factor
The maps in the presentation (below) really help illustrate the suprise factor of the credit crunch.. little of the previous patterns would prepare the UK investor for what was about to come. The flows show that investors did not recognise the risks inherent in 2006-2008. This is because the industry uses conventional fund metrics, which were at best outputs not guides..!
"Only 3 per cent of consumers would be prepared to pay over £100 per hour for independent advice and half would not pay any fee, according to Aviva research.
ReplyDeleteAn ICM poll of 2,053 consumers conducted for Aviva shows that 50 per cent of people would refuse to pay anything for independent advice and would rather not receive advice at all.
Seventeen per cent say they would be willing to pay less than £25 per hour. Less than 3 per cent say they would be prepared to pay anything over £100 per hour for independent advice.
Average rates for giving independent financial advice usually range from between £75 to £163;250 an hour"
Interesting how supply-demand might change post-RDR or what IFAs can do to operate at sufficient margin.
If the Tories intend for masses to be catered with free advice - what then of the commodity value of IFAs..? "The Conservatives say their free national financial advice service would cost the industry £50m per year.The Tories put forward their proposal for a free advice service yesterday as part of their economic manifesto proposals. A Conservative spokeswoman says the service would offer consumers impartial advice on money matters via face-to-face sessions, telephone advice and online advice."
ReplyDeleteAlso - the trends for IFA are negative:
"Only 3 per cent of consumers would be prepared to pay over £100 per hour for independent advice and half would not pay any fee, according to Aviva research. An ICM poll of 2,053 consumers conducted for Aviva shows that 50 per cent of people would refuse to pay anything for independent advice and would rather not receive advice at all.
Seventeen per cent say they would be willing to pay less than £25 per hour. Less than 3 per cent say they would be prepared to pay anything over £100 per hour for independent advice. Average rates for giving independent financial advice usually range from between £75 to £163;250 an hour"
Which maybe leaves 3/4 outcomes: that the value of advice will rise post-RDR, that advisers fund ways to increase the value (demand) for advice or that they pursue a different segment (supply). The last option is to find a way to trade at economies of scale on low margin profitabily - this is the least scalable and intensive option.