Tuesday 22 December 2009

The problem of WHEN we talk about Risk..

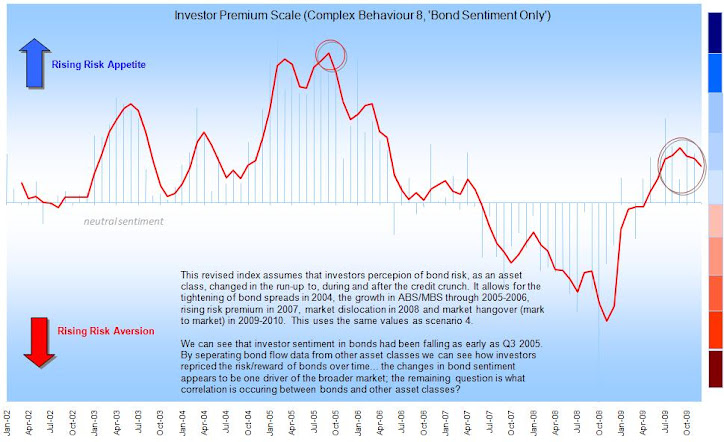
As a fund-analyst and product manager between 2001-2008 I was struck by the absence of market risk discussions from 2006 into 07.. Many insightful bods were talking about credit bubbles and historically low cross-sector volatility from about 2006 and yet little was out in the open. I was running large cross-sector comparisons and the price correlations (Rsquared) did indeed look pretty alarming; also there were large rotations in sales flows (20% of total market) away from less risky asset classes into those with much more: overall market size had also grown by at least 20% (which means that at least 1 in every 5 trades was borrowed or loaned to someone) - herding patterns looked sentiment driven; investors were reacting to media and moving irrationally into a small number of distinct directions, to find better returns, unaware of the rising levels of passive market risk they were creating by doing this. By the start of 2007 all the markets needed was a catalyst to convert that risk into loss..
Cue credit crunch and the doom merchants move in; crunch gave way to recession.. before we knew it we were heading back to 1931 (or worse).. Suddenly 'Risk' was all the vogue.

At risk of becoming yet another self-prophesising hindsight peddler; I will say this.. talking about 'Risk' in the trough of a bear market (like 2008) was akin to playing Russian roulette and worrying about an unloaded gun after it had fired the bullet.. sure there was plenty of toxic debt, unemployment, thrift paradox, stagnant GDP, plenty of write-downs, falling prices, busts, economic symptoms everywhere but the 'Risk' of these events happening became virtually nil in 2008-09 because they had already happened.

No, 'Risk' should be the likelihood of when/where something might happen.. before it happens. Risk is quantifiable; uncertainty is unidentifiable. As we move into a recovery phase I again see the 'Risk' conversations disappear from the table.. just when we should be talking about it again!

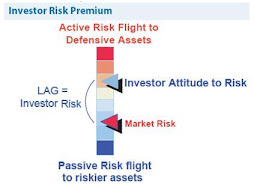
Recession v Recovery? On the basis that Risk in a recession is quite different to during a recovery then I will try to relate risk in this way: think of Risk as consisting of 2 parts Active and Passive Risk - in a newtonian sense there is a constant level of risk to the investor that simply doesn't go away; it merely changes from active to passive and back again. The change is brought about by investor reactions and the flow of money. By tracking investor herding patterns and attitude to risk we can better understand where risk is/isn't for most of the time.

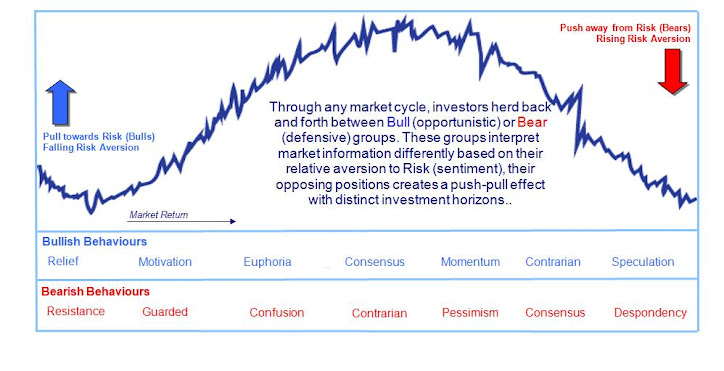
The first thing to appreciate is that there are ALWAYS TWO sides to the market: the Bulls and the Bears - which direction the market takes depends on who is winning the argument - by winning the argument I mean which side investors believe and move towards.. the more whom defect then the greater the chance of driving market prices in that direction.
When investors reach consensus on something and trade (BUY/SELL) in the same direction then this is called 'herding'
When I mean markets I of course mean the stock exchanges; economies are less driven by immediate investment decisions; or obvious sentiment, but economies do display symptoms over a longer time period. Many believe there is about a 6-18month lag effect between the markets and economies: they drive each other but tend to always be out of sync. Much like investors and 'Risk'.

Depending on market performance, different behaviours will emerge from the Bulls and the Bears.. we can test the current point in this cycle by tracking investor buying patterns.


More to the point: I hope to highlight risk levels back to you as we make our investment decisions.

1 comment:

  1. An interesting point raised by my learned friend Kon, on the Black Swan forums..

    "Having just read several papers by Kahneman and Tversky on investor psychology and prospect theory, all I can say is that it would take me a long time to really appreciate the depth of their research. Basically, you don't want to have the inmates running the asylum - why worry about investor sentiment? Investors are not rational, and this is exactly what Kahneman and Tversky found. So tracking investors is actually not a good way to make investment decisions. Instead, you may want to concentrate on what actually works to deliver good investment results."

    I'll admit that my approach would be contrarian even among contrarians but like chaos theory there is something intruiging about managing money surrounded by irrationality. Putting aside all of the economic factors as symptoms; investor sentiment drove the credit crunch, the drawdown and the recession. That is why it is important imo.

    Individually I wouldn't disagree with Kon's interpretation of Kahneman/Tversky vis a vis the role of investors and I'm still reading their work also; I would simply keep an open mind that investment markets have become social systems and thus cast up sociological problems rather than psychological pathegons.

    Why? - we opened the door and allowed investors to make their own investment decisions, unbundled pension schemes, gave investment choices etc etc. The amount of money attributed to individual investors (collectives) has risen dramatically, traditional institutional investing is in decline globally.

    Simply put I have suspected for some time that investors are not the happless passengers of market events that they are made out to be; they interact and create their own risk.. indeed perhaps the largest source of market risk. Individually the mind of the investor can be easily boxed up but when money flows start to shift en mass then it's worth taking notice: Tech, HY Bonds, MBS, CLO/ABS, China the list goes on.

    Perhaps markets ARE an 'asylum' to use Kon's anology: People run economies not politicians.. a good example being the 'paradox of thrift'. After all an investment manager only manages the money given to him by an investor in return for a fee. If enough investors withdraw then no system can deliver investment results.

    Practically, no mutual fund has sufficient cash in their box to withstand a pronlonged run AND make the expected return.

    Rationality in a single investment decision is one thing but we need to face the reality that the herd is capable of being guided, cajoled, influenced 24/7 - continual push-pull forces are at play for their hearts and minds. When enough investors get together then not even the best financial minds can do anything to swim against that tide.. the only thing they can do is either swim out of its way or swim with it..

    By no means am I discounting Kahnemann nor proposing that I am necessarily right; the psychologists wrong, simply that I have observed enough patterns to make me question. I will continue to track and relay anything useful back to the group.

    ReplyDelete

Note: only a member of this blog may post a comment.

Quote of the day: "Great spirits have always found violent opposition from mediocrities. The latter cannot understand it when a man does not thoughtlessly submit to hereditary prejudices but honestly and courageously uses his intelligence." Albert Einstein (attributed)

Investment U


Delta changes in risk aversion (Nov09)

Sentiment: The 'Lag' Effect

Sentiment: The 'Lag' Effect
Investor perception of risk is rarely up to date

Global Consciousness Project (GCP) 'Dot'

The Global Consciousness Project collects random numbers from around the world. This is a real time data analysis of the GCP. It collects the data each minute and runs statistics on the stream of random numbers generated by the project. This analysis is run 10 minutes behind the generation of the data. In this way, it can be seen as a real-time indicator of global consciousness coherence. http://gcp.djbradanderson.com/ BLUE DOT: Significantly small network variance. Suggestive of deeply shared, internally motivated group focus. The index is above 95% BLUE-GREEN DOT: Small network variance. Probably chance fluctuation. The index is between 90% and 95% GREEN DOT: Normally random network variance. This is average or expected behavior. The index is between 40% and 90% YELLOW DOT: Slightly increased network variance. Probably chance fluctuation. The index is between 10% and 40% AMBER DOT: Strongly increased network variance. May be chance fluctuation, with the index between 5% and 10% RED DOT: Significantly large network variance. Suggests broadly shared coherence of thought and emotion. The index is less than 5% The probability time window is one hour. For a more information on the algorithm you can read about it on the GCP Basic Science page

Choosing Mutual Funds..

Choosing a Mutual Fund – CLUE “it is not about past performance.." You could try - Logic Scoring! The trick is to create your own metrics and populate them into your own grid.. Always remember to test your assumptions v outcomes: your model may be right but you may find what you thought to be a SELL is actually a BUY. Always look at the problem in the mirror! You can also read this in conjunction with my guide on Value at Risk and other Key Risk Indicators below. http://tinyurl.com/ydvf3zh

Bull versus Bear Investing; versus Herding

The lifecycle (or holding period) of an investment held by a particular investor, often categorised as short, medium or long-term.

Let's get normal volatility out of the way first.. VaR-based toolkit.

Ok - a starting point - let's get normal volatility out of the way first.. This pack was written around end Q308 - post 16/8 but before the massive movement of Oct-Nov08. For those who support brownian motion or the geometric movement of returns then, I'm afraid to say, it's going to end bad..

What is the fuss with volatility.....

Re the movement of market returns - many believe they follow a geometric or exponential Brownian motion ('GBM') which is a continuous-time stochastic process in which the logarithm of the randomly varying quantity follows a Brownian motion, also called a Wiener process. It is used particularly in the field of option pricing because a quantity that follows a GBM may take any positive value, and only the fractional changes of the random variate are significant ('deltas').

http://en.wikipedia.org/wiki/Geometric_Brownian_motion


So in practice 'brownian motion' assumes a strong tendency to trend - it says that returns won't jump from day 1 to day 2 but move up and down in fairly predictable increments.. the returns of the previous days have an impact on the subsequent day - they are not unique. This estimation of how prices move is the underlying principal for the future pricing of derivatives contracts such as options.. i.e. E.g. to buy a contract, at one price, to buy or sell the underlying asset at a future date at a future price... this is usually referred to as the 'Black-Scholes formula' or the much much earlier Bronzin model (1908). This ties up with the old-age 'law of big numbers' (or law of averages) - where returns follow a pattern around a mean and that the volatility around that mean diminishes over time.. Where those returns are then assumed to form a normal distribution (or bell curve) then the 'GBM' is symmetrical to the mean of those returns. BUT what if we do not believe upside and downside returns will be similiar?.
A LOT of analysis has been run since to dispel this view such as many variations of the the Noble winner Robert Engle's ARCH approach in 2003 ('heteroskedasticity'.. or the analysis of different dispersions/volatilities), countless variations thereof, stochastic models (see below*), extreme loss analysis, stress testing, scenario analysis and so on - it keeps the Math boys busy shall we say...

*Stochastic models: treat the underlying security's volatility as a random process, governed by variables such as the price level of the underlying, the tendency of volatility to revert to some long-run mean value, and the variance of the volatility process itself, among others. Somtimes I use Markov chain as the easiest way to visualise and understand a random process: usually it's illustrated by the cat and the mouse:

Suppose you have a timer and a row of five adjacent boxes, with a cat in the first box and a mouse in the fifth one at time zero. The cat and the mouse both jump to a random adjacent box when the timer advances. E.g. if the cat is in the second box and the mouse in the fourth one, the probability is one fourth that the cat will be in the first box and the mouse in the fifth after the timer advances. When the timer advances again, the probability is one that the cat is in box two and the mouse in box four. The cat eats the mouse if both end up in the same box, at which time the game ends. The random variable K gives the number of time steps the mouse stays in the game..

This Markov chain then has 5 states:

State 1: cat in the first box, mouse in the third box: (1, 3)
State 2: cat in the first box, mouse in the fifth box: (1, 5)
State 3: cat in the second box, mouse in the fourth box: (2, 4)
State 4: cat in the third box, mouse in the fifth box: (3, 5)
State 5: the cat ate the mouse and the game ended: F.

To show this for a fairly infinite number of price movements is somewhat less achievable but nonetheless that's what the clever bods have done..

Otherwise most of probability, I admit, is above my head unless it descends into some sort of practical application - BUT I get the sub-plot.. stop trying to predict future patterns from regressing past performance... show me the track record of a model (after it has been created) and I'll be one step closer to being converted.. I'll touch on stress testing, extreme analysis ('extremistan') and scenarios another day..

"The Black–Scholes model disagrees with reality in a number of ways, some significant. It is widely employed as a useful approximation, but proper application requires understanding its limitations -blindly following the model exposes the user to unexpected risk. In short, while in the Black–Scholes model one can perfectly hedge options by simply Delta hedging, in practice there are many other sources of risk." Wikpedia

http://en.wikipedia.org/wiki/Black%E2%80%93Scholes


Active-Passive Investing Debate

Performance Patterns: **This deck is based on some work-based research so apologies for the confusing arguments - as a consequence the 'story' in the slides is a little muddy so I will re-jig this in the New Year to make my points clearer.** Passive-active purchase drivers in the UK are less differentiated/defined than perhaps elsewhere; the basic rules apply: What I did find was that there were interesting herding flows preceding, into and of the credit crunch. These were large asset-class movements: something which active managers would have little control of unless they ran absolute return type startegies. What my analysis showed is that an investor could manage a passive portfolio tactically to take advantage of large herding patterns. This involves risk, access to the right data, practice and above all discipline but I hope it will be a journey we can share!!

Lessons for 2010 - REIT Funds

Noting the events around 2005-2008 make for interesting considerations when thinking about buying REIT Funds in 2010..

The UK Investor - The Surprise Factor

The maps in the presentation (below) really help illustrate the suprise factor of the credit crunch.. little of the previous patterns would prepare the UK investor for what was about to come. The flows show that investors did not recognise the risks inherent in 2006-2008. This is because the industry uses conventional fund metrics, which were at best outputs not guides..!

The UK Investor - IMA 'Map' 2002-2008

Jon Beckett, ASCI - Past Projects (2003-2008)

I have been involved in the IFA and investment market since 1998, covering a broad range of roles. I have engaged a number of industry bodies over the years, to be a voice for change, to reform our industry and make it trusted and respected. None of the projects shown should be related to Franklin Templeton either: explicit, inferred or otherwise. I attach some of my past projects from 2004-2008.. Rgds JB