Money on the move again - BUT where is Japan heading?
2009 was quite frustrating for me - the equity index levels at the bottom of the last trough were clearly underpriced and sentiment driven (as were YTMs on High Yield and EM bonds) - recession woes had a firm grip and of course liquidity was even more scarce then; than salt is now to clear my driveway from ice..! And so my pension transfer arrived late (October) and I missed the party.. Asia and EM Mkts were up and even the footsie has made easy double-digit returns.. doh! I consoled myself with some small gains in metals which I posted a few weeks back.

In terms of growth since March 2009 then Asian Equities already looked expensive - Emerging Mkt momentum into bonds/equities accelerated into Q4. However IF the UK's IMA numbers for November are replicated across Europe then I suspect that support has already slowed; IMA showed a fairly large rotation into Cautious Managed funds). What is clear is that assets are on the move again and rotating. If we look at the latest confidence indices then these appear to have fallen back by December; (still well above 2008 but down nonetheless) - the 'herd' seemed to be taking stock of the strong recovery and perhaps profit-taking on the assumption of a sluggish 2010; (similiar to 2004).
Lipper FERI are among the best trackers of sales flows in the world and I have the priviledge of working with them closely over the years. Their Asia coverage and research is becoming especially good.
Here is a link to their latest bulletin:
http://www.lipperfmi.com/FERIFMI/Information/Files/FFAsia%200911%20Nov.pdf
I'll start tracking the performance and sales flow movment for Japan funds for your benefit.
"Japanese savers moved aggressively into Real Estate, higher-yielding bonds and the more racey equity sectors.. China, Hong Kong and Japan were in fact the only exception to Asia’s one consistent theme — the nearwholesale reluctance to invest in equities. In these three markets, the overwhelming bulk of new money went into Chinese stock funds" FERI
Q. If the Japanese are not buying Japanese Equities then why should we? The answer could be currency play of Yen..?
BUT a New Year and those end of year blues may give way to a new bull market. IF we see strong 'recovery' indicators for Q1; and supportive media, then there is no reason to assume anything other than the normal 2-3 bull market. What is perhaps plausible is that the bull market will not last as long simply because the previous drawdown occured and corrected faster than usual. This is in keeping with my earlier view that cyclical volatility will become more extreme due to the increase of investor information, greater private investor controls, de-institutionalisation of assets, globalisation and the rise of high frequency trading.
So what of Japan and is it a BUY or indeed heading down to China town?
A misnomer? Japan has always traded somewhat out of sync with its neighbours and indeed US/Europe. Primarily this has been much to do with the industrial make-up of Japan and it's unqiue inflation cycle and banking set-up. Japanese financial policy and political volatility have driven a weak Yen, which in turn fuelled the Yen carry-trade - for me this has been used excessively by outside investors/banks to keep the Yen weak. It has been the convenient source of easy liquidity to grow markets. However now Japanese banks are strong again; (if a shadow of their former pre-97 glory).
The economics of Japan are complex and not entirely convincing - too much for me without some saki; and sometimes I don't think anyone really knows why Japan is out of sync with its neighbours. As China, India and Korea become more influential as trading partners within the ASEAN sector then perhaps that legacy won't last forever.
As one Hargreaves analyst wrote recently.. "After 53 years of single party dominance the market is still searching for firm direction from the newly elected Democratic Party of Japan. Will they be able to deliver the changes set out in their campaign? The jury is still very much out, and many in Japan remain sceptical. Nonetheless, in contrast with the previous government, the new Prime Minister has stressed the importance of deepening ties with other countries, notably China. This is a sign that Japan might become more fully integrated into Asia, which could be positive for many Japanese firms in the long term. Despite its problems, I think Japan still possesses the ingredients for a potential bull market: Low valuations, growth in mergers and acquisitions (Panasonic has just bought 50% of Sanyo for example) and a recovery in company earnings. I remain of the opinion that Japan will eventually have its time in the sun. What is still unclear is what the catalyst will be for market sentiment to improve."
So - simple says - for me Japan's TOPIX looks cheap at 3-5 yr levels - I am prepared to sit out for a cpl of years for a 20-30% recovery, vested via a cheap ETF. I am less certain of tier 2 smaller companies and so have opted for the main index; (the discount looks similiar). The one risk I haven't taken into account is Sterling v Yen and perhaps based on my notes above I should focus on the Yen rather than the stocks..
Quote of the day: "Great spirits have always found violent opposition from mediocrities. The latter cannot understand it when a man does not thoughtlessly submit to hereditary prejudices but honestly and courageously uses his intelligence." Albert Einstein (attributed)
What is the fuss with volatility.....
Re the movement of market returns - many believe they follow a geometric or exponential Brownian motion ('GBM') which is a continuous-time stochastic process in which the logarithm of the randomly varying quantity follows a Brownian motion, also called a Wiener process. It is used particularly in the field of option pricing because a quantity that follows a GBM may take any positive value, and only the fractional changes of the random variate are significant ('deltas').
http://en.wikipedia.org/wiki/Geometric_Brownian_motion
So in practice 'brownian motion' assumes a strong tendency to trend - it says that returns won't jump from day 1 to day 2 but move up and down in fairly predictable increments.. the returns of the previous days have an impact on the subsequent day - they are not unique. This estimation of how prices move is the underlying principal for the future pricing of derivatives contracts such as options.. i.e. E.g. to buy a contract, at one price, to buy or sell the underlying asset at a future date at a future price... this is usually referred to as the 'Black-Scholes formula' or the much much earlier Bronzin model (1908). This ties up with the old-age 'law of big numbers' (or law of averages) - where returns follow a pattern around a mean and that the volatility around that mean diminishes over time.. Where those returns are then assumed to form a normal distribution (or bell curve) then the 'GBM' is symmetrical to the mean of those returns. BUT what if we do not believe upside and downside returns will be similiar?.
A LOT of analysis has been run since to dispel this view such as many variations of the the Noble winner Robert Engle's ARCH approach in 2003 ('heteroskedasticity'.. or the analysis of different dispersions/volatilities), countless variations thereof, stochastic models (see below*), extreme loss analysis, stress testing, scenario analysis and so on - it keeps the Math boys busy shall we say...
*Stochastic models: treat the underlying security's volatility as a random process, governed by variables such as the price level of the underlying, the tendency of volatility to revert to some long-run mean value, and the variance of the volatility process itself, among others. Somtimes I use Markov chain as the easiest way to visualise and understand a random process: usually it's illustrated by the cat and the mouse:
Suppose you have a timer and a row of five adjacent boxes, with a cat in the first box and a mouse in the fifth one at time zero. The cat and the mouse both jump to a random adjacent box when the timer advances. E.g. if the cat is in the second box and the mouse in the fourth one, the probability is one fourth that the cat will be in the first box and the mouse in the fifth after the timer advances. When the timer advances again, the probability is one that the cat is in box two and the mouse in box four. The cat eats the mouse if both end up in the same box, at which time the game ends. The random variable K gives the number of time steps the mouse stays in the game..
This
Markov chain then has 5 states:
State 1: cat in the first box, mouse in the third box: (1, 3)
State 2: cat in the first box, mouse in the fifth box: (1, 5)
State 3: cat in the second box, mouse in the fourth box: (2, 4)
State 4: cat in the third box, mouse in the fifth box: (3, 5)
State 5: the cat ate the mouse and the game ended: F.
To show this for a fairly infinite number of price movements is somewhat less achievable but nonetheless that's what the clever bods have done..
Otherwise most of probability, I admit, is above my head unless it descends into some sort of practical application - BUT I get the sub-plot.. stop trying to predict future patterns from regressing past performance... show me the track record of a model (after it has been created) and I'll be one step closer to being converted.. I'll touch on stress testing, extreme analysis ('extremistan') and scenarios another day..
"The Black–Scholes model disagrees with reality in a number of ways, some significant. It is widely employed as a useful approximation, but proper application requires understanding its limitations -blindly following the model exposes the user to unexpected risk. In short, while in the Black–Scholes model one can perfectly hedge options by simply Delta hedging, in practice there are many other sources of risk." Wikpedia
http://en.wikipedia.org/wiki/Black%E2%80%93Scholes
The UK Investor - The Surprise Factor
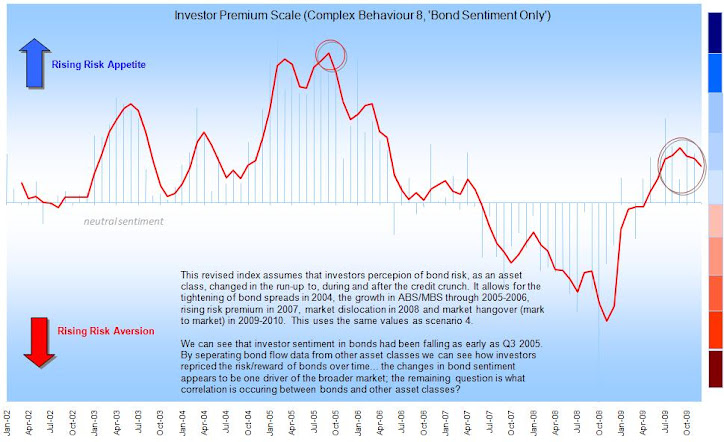
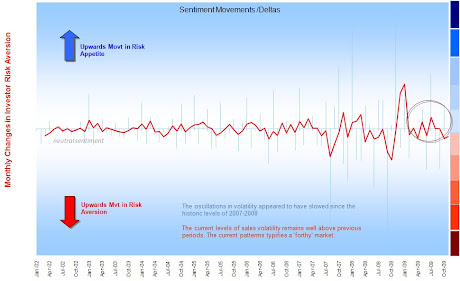
The maps in the presentation (below) really help illustrate the suprise factor of the credit crunch.. little of the previous patterns would prepare the UK investor for what was about to come. The flows show that investors did not recognise the risks inherent in 2006-2008. This is because the industry uses conventional fund metrics, which were at best outputs not guides..!


I wanted to follow up quickly on Japan - I was watching an interesting documentary about Japan tonight and realised I hadn't figured in Japan's ageing demographic, tough immigrant laws and gloomy 2050 forecasts as a result.. Japan is to all tense purposes a dying economy.
ReplyDeleteDo I wish I hadn't invested - 'no'.. I am, after all, in for a relatively short 'play' but it does serve as a cautionary note about long-term allocations. I might get out sooner as a result.
Once the UK invested heavily into Japan Equity as the main entry point into Asia; (and a geared play on the US via exports). Now that position has changed as China, India and Korea take the lead. Perhaps only the Yen carry trade remains to entice but we know that's fairly reliant on the politicians.. (see also my note on $:£ and currency - the same checklist applies for the Yen).
An interesting article at Investment U on the subject.. supports the contrarian recovery play:
ReplyDeletehttp://www.investmentu.com/IUEL/2010/February/investing-in-japan.html?utm_source=feedburner&utm_medium=feed&utm_campaign=Feed%3A+InvestmentU+%28InvestmentU%29