Wednesday, 27 January 2010

Complexing Returns - the Absolute Truth!!

My friend John and I recently chatted over the pros and cons of 'Absolute Return' funds, which have gained popularity through 2008-2009 and look set to re-define the Defined Contribution pension market away from Equities; (just as in the 2000s pension schemes moved away from Bonds to Equities). John raised a valid dilemma:
"certainly a lot of noise around about absolute return as a DC solution at the moment. Personally, I'm a bit wary of using absolute return as a default fund for group pension scheme members as the nature of the fund would have to be explained because there is no guaranteed return. This would require explanation that the manager is buying derivatives with their money with the broad aim of achieving XYZ. For most scheme members, this would be too complicated."
Simply put - Absolute Returns ('Abs Return') funds set out to return a positive level of growth through all market periods; usually benchmarked against a level of return over a broad cash rate (E.g. London InterBank Offer Rate 'LIBOR': the rate banks used to lend each other money). However to achieve this objective requires a means to achieve risk-free returns in excess of the risk-free rate ('Rf'). The notion that you can't have your cake and eat it holds true and the manager in reality has to buy risk in de-correlated asset classes, carefully blend and offset together to achieve a level of risk that is similar to cash but with better performance - of course this is entirely synthetic and an Absolute Return portfolio contains a number of risks not present in deposits, short-term paper nor indeed Guaranteed funds!!

Hard to track and getting harder by the minute. The manager has to use what we call the 'opportunity set': a broader range of asset types including leveraged loans, derivatives, swaps, asset backed securities 'ABS', mortgage backed securities 'MBS', subordinated debt etc at the sharper end of the debt market. In those markets you also have dark liquidity pools (unquoted markets) and plenty of OTC (over-the-counter contracts).. complex pricing, lots of default risk, dollar roll risk, currency risk, lots of liquidity risk.

Putting members aside for a second - for those who administer pensions I think confusion will be common to both DC and trust-based schemes - how many trustees will 'get' absolute return, let alone be in a position to set a statement of investment principles around them is hard to say. It places much more onus on ALM, good for the EBCs and consulting actuaries.. bad for costs, which at some level will need to be passed back into the employer or the employee. The pressure on scheme managers and trustees is set to rise as more and more 'governance' is introduced.

I helped bring an Abs Return fund to market in 2008; plus in the thick of it when the first batch of Abs Return funds imploded around the credit crunch and tried to get one rated with S&P at the same time. I recall it involved lots of time spent tracing volatilities/spreads in LIBOR v SONIA, 1yr v 3yr horizons.. lots of pitfalls from a TCF perspective also. The lead analyst for S&P was writing various scathing reports for the press - safe to say we put the rating idea on ice..
Coincidentally I also sat on EFAMA's EFCF working committee back then (on and off for about 5 yrs) and we debated and created some ground rules and definitions for 'Absolute Return'. Alas the FSA/IMA,NAPF,ABI are taking their time to adopt these sets of definitions, fist set down in 2007-08, which I think is leaving too much latitude in the sector. At that time the underlying investments were disparate and varied greatly - they still are with no common benchmark - very much a 'wild west' facilitated largely by UCITS3. It felt like the hedge fund days all over again but we'll see if the market is tightened with UCITS4..
The only common denominator being LIBOR or EONIA avg. targets +30bps, +50bps and so on.. However the Dutch NL-AFM 'GUISE' model is probably the most developed in terms of identifying risks in these and other funds. Interestingly the Dutch system scores anything but G'teed as 'High Risk'..

The alternative is structured products - G'teed/Protected funds or bonds. These of course pass the risk onto a counter-party or reinsurer and there were problems in 2008 via counter-party defaults, as assets were marked-to-market. Target maturity funds are useful as they are 1) simpler than Absolute Return and 2) can be used in a maturity ladder against employee expected retiral dates. The irony is that Abs Return (aka portable alpha) strategies started in the occupational market in the early-mid 2000s and were then subsequently 'rebranded' into Abs Return (the flip side being 130/30, 1xo/xo funds).

What were once seen as fairly staid, low risk investments suddenly became sexy, repackaged and marketed in an entirely new way as a new asset class (a means to beat the 'system'). The misgiving was that few clients undergo an Asset-Liability review ('ALM') as would occur in a pension scheme - this is a real oversight since the way the fund is invested is blind of the goals and circumstances of the investor. This would be fine if the level of variance possible year on year was tightly controlled but that's not always the case, with enough flexibility in the investment objective to allow the manager a 'get-out' if the going gets tough and the investor not leg to stand on. Barmy!

What seems clear is that there is a very distinct mood change that feels similar to when DC schemes moved away from Gilts, then again Corp Bonds in favour of Equities. I'm keeping my eye on IPE.com, the occupational pension website, to track this shift across Europe. Much of this is going to be fuelled by employer DB schemes waving the white flags after the last market drawdown.

There are returns to be had in Absolute Return funds but they are far from absolute!

Saturday, 23 January 2010

Gloves off - Active versus Passive Funds.. Round1

The rise of Exhange Traded Funds ('ETFs') is now becoming interesting and has really energised the whole 'active-passive' debate in the last 2 years. Pioneered in the UK by Barclays (IShares) there has been an increasing number of new entrants into the UK market, which are far more dynamic in both product and marketing than the 'trackers' of old.. Once there was not much challenge for active fund managers since trackers were pretty uncompetitive and agricultural beasts, offering exposure to a handful of markets..and really for the pie n chips TESSA/PEP/ISA and pension brigade.. UK FTSE100 or Global Equity were typical..

Now companies such as Vanguard, IShares and Dimensional are keeping active managers on their toes.

Current largest ETF providers in the International (non-US) market: Source Ronin Research


Active managers have been under fire for many years in proving and justifying their alpha and management charges. Back in 2006 I remember Garbriel Burstein of Reuters fame presenting about 'alpha as the factor of betas'.. what he meant was that very little 'alpha' could actually be found on investigation - indeed many of the founders of CAPm and MPT (Capital Asset Pricing model and Modern Portflio Theory) refined the original crude calculations to account for this (the basic formula are still the ones used in fact sheets today). In reality many active managers just bought more risk or got lucky on the timing.. some were in fact passive in tracking an index but still charging for an active approach.. naughty naughty! Back then I opposed such a view but in 10 years of fund analysis it's true that I have found little alpha that I could confidently attribute back to a fund manager.

There are 2 distinct polarised sides to this debate - Active managers who charge an investment fee to beat the market and the 'Passive' managers who charge less to provide the returns of the market. However the situation has become increasingly muddied by the introduction of Active-Passive funds from the likes of 7iM (Seven Investment Mgt) and IShares (Blackrock) adds another dimension and more difficult options for the investor. These are Fund of Funds ('FoFs') where the manager invests in low cost ETFs instead of actively managed funds.. nifty! It's fair to say that they offer multi-manager funds (and FoFs) a lifeline as they have been long-derided for their 'double tap' charging..

So - on one hand active managers will point towards the creation of 'alpha'.. that is the residual return over markets, and revel in the fact that indices do have a habit of levelling out over the longer-term (leaving ISA investors with 0% after 3-5 years). On the other side ETF and passive fund providers point out that few active manager funds can actually generate 'alpha' consistently and over-charged for the priviledge.
2 things are largely unknown in the UK today - 1) does active or passive return the best returns - there is so much propaganda on both sides that investors have little chance of knowing; nor is active and passive performance adequately benchmarked to allow investors make a fair decision. 2) when do active and passive strategies perform (for the same reason) and thus which offers the best bang for your buck.

In my experience passive funds tend to do well in the early-mid-phase of a recovery and thus low drag is key; when it's hard to beat the index. Active managers take the advantage in the mid-late phase as the market becomes more frothy and outright index returns less prominent (2nd phase).

 In favour of Passive funds: (not neccessarily old style 'trackers')
  1. 'WYSIWYG' - i.e. transparency = if the FTSE100 moves up 10% - so does your ETF (some active sectors allow for a broad array of approaches than can mislead the investor; others are opaque in nature and difficult to understand)
  2. Low cost - often it's easy to trade ETFs with flat fees - generally an investor can enjoy a much lower )or zero) annual fee (reduction in yield, 'RiY'). The TER of most active funds will be around 1.5-2.5% p.a. The charging structure of ETFs suits investors who like to keep any investment advice distinct from their investment allocation
  3. Past performance is, relatively speaking, easier to attribute to an ETF than an active fund
  4. Mobility - it's easier and cheaper to move in and out of ETFs through online trading (active maangers rely on reoccuring fee structures - it is not in their interests to have short-term assets and as such they often penalize those who try to withdraw their money within 6-18mo of investing.. some might say this is not 'TCF' friendly; albeit perfectly 'legal' in the current market
  5. No people risk - there is no risk of errors, no threat of a loss of a key manager etc, generally speaking there are no good or bad ETFs (lenders perhaps) so choice between ETFs in the same sector comes down mostly to ease of access and price 
  6. Liquidity - ETFs appear to be easy to trade with a deep market to SELL when you want, usually same day; (active managers can delay in selling out and returning your assets). This also tends to minimize FX risk
  7. An ETF is individually unaffected by the inflows/outflows of the fund manager or how big/deep the market becomes (some fund managers can become hamstrung when trying to handle large sums; some mandates need large sums to have buying power and struggle if they lose assets - victims of their own success/failure)
  8. There is no need to benchmark an ETF (relative return is a sin of the active management industry imo - benchmarks are often chosen on ability to be beaten and often deviate substantially from the fund; composites on the other hand lack real-world or transparency for the investor
  9. All past performance can be attributed back to the ETF/index without need to check for changes in people, process or portfolio - comers back to WYSIWYG
  10. Diversification - you can buy one ETF to cover 500, 5000, 25,000 stocks... they are also easier to allocate into a larger portfolio with less chance for overlap or unwanted concentration (fund managers are known to drift, rotate which makes tracking your active exposure very tricky - most only report their top 10 holdings on a monthly basis)
  11. Investor control - the ability to tactically manage your own targets and take you rown view on markets
  12. Generally speaking ETFs suit those investors whom want to invest for the short-medium term
In favour of Active funds: (open-ended; closed funds such as Investment Trusts are different)
  1. Clarity of process and position against the market - a 'people' element
  2. The promise of diversification and stock selection to minimize downside
  3. In some cases a higher beta strategy (like a growth fund) will be expected to outperform in a rising market by buying smaller companies or weighting in favour of more cyclical sectors (E.g. Technology)
  4. Income managers can use cash flow to diversify the risk of price volatility - known as a total return strategy
  5. Active managers can plan when to BUY and SELL - to time the market and take advantage of price drops, avoid price bubbles, herding or capitalise on over-liquidity in certain sectors
  6. Through superior analysis active managers can potentially spot inefficiencies in the market such as a stock price and take advantage
  7. Some active managed funds are designed to suit a certain attitude to risk or investment horizon (risk based and target maturity funds) - this allows the investor to largely fire n forget their investment until such time they want to encash or change, useful for those who prefer to avoid financial advice
  8. Most actve managers can hold alternate assets for limited times or rotate to cash in the event of a downturn - some managers have perfected this to become 'all weather' managers
  9. Most active managers can now hedge their long-positions (it's less easy to hedge efficiently through ETFs) and they can also hedge their FX exposure when investing overseas
  10. Some strategies such as Absolute Return are difficult to index and thus recreate as an ETF, they are designed to be less cyclical and (all other things being equal) then past performance could be a better indicator for that type of strategy than for a 'blind' index product (this is FSA blastphemy I know!!)
  11. There remains more choice of strategy among active managers than in passive funds; (the gap is narrowing)
  12. Many active funds offer different share classes to suit investor needs; some offer currency protection when enchashing units in a fund denominated in a different currency
  13. More modern boutiques are beginning to offer performance-related fee structures
  14. Increasing use of single NAV pricing (OEICS, SICAVs) means there is usually no bid-offer spread to worry about at encashment
  15. Generally speaking active funds suit those investors whom want to invest for the medium-long term
So the first point to make here is that neither can be a 'single solution' no matter what the providers or advisers tell you - active will suit some; passive others.

Passive funds often do better on the downside than active; (unless the manager is particuarly good at being defensive) due to lower Reduction in Yield (the 'RiY'). This comes down to simple costs v returns. Most active managers will continue to charge even when returns in their Fund are falling! The resulting cancellation of units then not only increases losses but it also comprimises the subsequent recovery. Key here is the implications on mainstream active fund managers applying performance-linked fees.. In the UK there is a skewed perception we have of index products such as ETFs being only equity-based. In fact there is a broad range of asset classes available.. given the large asset rotations it's plausible that passive strategies are an easier way to manage your asset allocation against herding and sentiment risks.. Europe and the US have already taken advantage and the UK will be next.

Passive charges = [Flat trading charge on entry (usually <1%), flat charge on exit (usually <1%), typically no annual charge, price Bid/Offer spread (market quoted, typically 2-5%) on sale.]

Active charges = [Initial charge (can be up to 6%), total annual charge which can include: management fee, admin fee, custodial fee, distirbution fee (typically 1.5-2% p.a.), price Bid/Offer spread (typically 5%) on sale unless mid-point priced, early redemption fee (can be up to 5%) on some funds in the first 1-3 years.]

Outcome = As a rough estimate of the above then any given ETF may cost the investor 7% (usually much less) in fees over a 3 year period; compared to anywhere between 9.5%-17% over the same period for an active fund. IF assuming reinvestment over those 3 years, similar underlying assets and a growing market, then the impact annual charges would have on a compounding return would make that difference even greater (c.2.5%-10%)!! This places a great amout of onus on the active maanger to at least find a residual for the same level of risk, over the ETF, or return even more gains, proportionally to the risk taken (hence more skill).

What my analysis showed is that an investor could manage a passive portfolio tactically to take advantage of large herding patterns. This involves risk, access to the right data, practice and above all discipline. What then for the rise of active-passive funds? Such funds will rely heavily on asset-allocation and avoiding unneccessary churning of their positions to keep trading costs down. Again this comes down to what premium is being charged for this investment 'skill', how easy such composites will be to benchmark and whether returns prove that active-passive is more than a neat re-packaging trick. For more info please feel free to refer to my CCC 'ETF' guide below the blog. I will re-jig it in the next cpl of weeks to make it a better read; (I'll be the first to admit it's a bit muddled.. stay tuned!). You could also consider building up your own logic grid to compare an active versus passive fund (see how by reading my guide on 'Choosing Mutual Funds - ')..

I suspect Active-Passive funds will take some benefits from both sides but I doubt they will offer the best of both..

Active management is all about trust - the money remains yours; you entrust it to an 'expert' to invest better than you can. If they consistently can do no better than what is available to you already, and for less, then you are simply paying a premium for a placebo.. a peace of mind which may or may not be misplaced. In truth I suspect this is exactly what a large % of the UK retail market is being encouraged to do.. it is the fear that has helped the retail pooled investment industry grow for many years.

Induced seismicity - the perils of financial intervention?

Earthquake {def} "also known as a quake, tremor, or temblor) is the result of a sudden release of energy in the Earth's crust that creates seismic waves. Earthquakes are recorded with a seismometer, also known as a seismograph. The moment magnitude (or the related and mostly obsolete Richter magnitude) of an earthquake is conventionally reported, with magnitude 3 or lower earthquakes being mostly imperceptible and magnitude 7 causing serious damage over large areas. Intensity of shaking is measured on the modified Mercalli scale." Source: Wikipedia

The horrible events in Haiti (a natural occuring event) made me think about seismic activity and the randomness of when earthquakes occur.. are they a black swan.. Not all such activity is random, it often clusters around epicentres - in the case of earthquakes: the tectonic plates. So earthquakes are more often grey swans: i.e. they are hard to predict, often uncertain but there is some certainty that they will occur at some point and exhibit a peristency in certain geographic regions. It is more risky to live in one place than another.. However induced earthquakes are the result of human intervention and seem far less certain. a very extreme example of how an action for good can cause a very negative outcome. I certainly don't want to trivialise earthquakes; definitely not now, and I hope to avoid -

"a rash of earthquakes have struck along the Pacific coast of the Americas, including a 6.0 earthquake that struck Guatemala yesterday (18/01) and a somewhat strong one in Argentina the day before."

Induced seismicity - are our attempts to regulate a system perilous: one we created but since evolved to become more complicated than we can understand.. Does one action to stem risk create the next..?
Induced seismicity - "While most earthquakes are caused by movement of the Earth's tectonic plates, human activity can also produce earthquakes. Four main activities contribute to this phenomenon: constructing large dams and buildings, drilling and injecting liquid into wells, and by coal mining and oil drilling. Perhaps the best known example is the 2008 Sichuan earthquake in China's Sichuan Province in May; this tremor resulted in 69,227 fatalities and is the 19th deadliest earthquake of all time. The Zipingpu Dam is believed to have fluctuated the pressure of the fault 1,650 feet (503 m) away; this pressure probably increased the power of the earthquake and accelerated the rate of movement for the fault. The greatest earthquake in Australia's history was also induced by humanity, through coal mining. The city of Newcastle was built over a large sector of coal mining areas. The earthquake was spawned from a fault which reactivated due to the millions of tonnes of rock removed in the mining process."
More real than notions of butterflies! "The phrase refers to the idea that a butterfly's wings might create tiny changes in the atmosphere that may ultimately alter the path of a tornado or delay, accelerate or even prevent the occurrence of a tornado in a certain location.. The butterfly effect is a metaphor that encapsulates the concept of sensitive dependence on initial conditions in chaos theory; namely that small differences in the initial condition of a dynamical system may produce large variations in the long term behavior of the system. Although this may appear to be an esoteric and unusual behavior, it is exhibited by very simple systems: for example, a ball placed at the crest of a hill might roll into any of several valleys depending on slight differences in initial position. 'Recurrence', the approximate return of a system towards its initial conditions, together with sensitive dependence on initial conditions are the two main ingredients for chaotic motion. They have the practical consequence of making complex systems, such as the weather, difficult to predict past a certain time range (approximately a week in the case of weather), since it is impossible to measure the starting atmospheric conditions completely accurately. " Source: Wikipedia. http://en.wikipedia.org/wiki/Butterfly_effect

So perhaps the problem in financial regulation is that it assumes 'domino effect': "The domino effect is a chain reaction that occurs when a small change causes a similar change nearby, which then will cause another similar change, and so on in linear sequence. The term is best known as a mechanical effect, and is used as an analogy to a falling row of dominoes. It typically refers to a linked sequence of events where the time between successive events is relatively small. It can be used literally (an observed series of actual collisions) or metaphorically (complex systems such as global finance, or in politics, where linkage is only a hypothesis)."

The tectonic plates: can we liken these to the money flows and correlations among sectors and asset classes..? Like markets; seismic activity is continual and analysed daily. Without intervention, earthquakes; like markets, will continue to display vary, grow and subside. Globally we track seismic activity intensely and in a very universal way; unlike financial markets, but shocks still continue (Haiti) - is this due to a lack of focus outside of the main regions of interest, an inherent ignornace of cause and effect, a lack of profit to care, are there lessons to learn for investors and regulators alike?

A 'seismic' notion is appealing because it gives some glimmer of hope of cause and effect to track volatility by; (even if the the lead time proves very short). This approach to volatility could allow for 3 attractive (and flexible) assumptions: 1) that volatility an have epicentres and ripple outwards to impact nearby asset classes (think China on Asia Pac, US on China on US.. domino effect) BUT also ripple along less obvious and non-geographic 'fault lines' of correlated classes (E.g. US-China, US Tech-Asia Tech, Global Property, US Treasury-EM Bonds, Commodities, Currencies.. butterfly effect) - perhaps caused by underlying liquidity changes during periods of market bubbles/crashes, behavioural decisions and conventional asset allocation techniques to sell from one asset class to buy another, or simply the globalisation of the financial market itself. 2) the location of epicentres can become random and unpredictable to track (just as correlations shift and sentiment/herding can become irregular - 'heteroskedastic') and lastly 3) intervention has/can create unexpected negative results (butterfly effect: from dotcom to credit crunch) and induce unexpected volatility.

Although these ideas have been considered (and discounted) many times; they have been largely tested through numbers rather than visually (consider the map below):


[def] "Causality is the relationship between an event (the cause) and a second event (the effect), where the second event is a consequence of the first." Can market volatility be mapped in this way?

Certainly central banks (amongst other things) set into motion a series of events in 2002 that later produced the credit crunch.. the primer was the low base rates - stimulating 'soft' borrowing.. and squeezing the returns of traditional debt markets.

If then we can't escape bull-bear cycles then why intervene? Political gain, control, fame, recognition, profit, morality.. are any of these worth the gambit?


Quote: "As far as I know, they are just sort of happening willy-nilly. And even, you know, one year to the other you can even get some fairly dramatic differences. For example, let me pull out a couple more numbers here. For example, in - there were relatively few earthquakes of this size in, say, 2009 compared to 2007. I mean, you do get year-to-year variety, but again, it - just because these things happen kind of unpredictably.Let's step back for a second and think about where earthquakes come from. You have the earth's plates, these tectonic plates, shifting past one another. And what happens is they don't move smoothly sort of over long periods of time. They rotate and they move past one another but they stick together. There's like friction that holds them still. So, basically, you have these two plates that are jammed together and eventually the stress builds up enough and bing. They release that stress all at once and that's an earthquake. So you have this kind of, you know, in the long term you know that = where the stresses are building up and how big an earthquake might be in a particular place. That's been fairly well established. But guessing when that rock is going to break, when that slip is going to happen, is beyond the realm of science right now. "NPR science correspondent Richard Harris, Jan 19th

Replace "earthquakes" then for any market loss term of your choosing: risk, beta, drawdowns, recession, volatility, correction, dislocation...

The Price is Wrong? (warning - may contain Bruce Forsyth)

As Bruce Forsyth might say - "higher, lower, higher, lower"!

Following Obama's announcement and the negative reaction in the markets - there are probably 3 large questions everyone is concerned about this weekend..
  1. Are we heading towards a 'W' shaped recovery - aka 'the double dip'?
  2. Has the market recovered too quickly.. are prices too high?
  3. Should I take my profits now (if I have any) or wait?

IN response - there are equally 3 things to note at this stage:

1. Economies and market indices are not perfectly correlated: one is the input of market sentiment (do we BUY, SELL or HOLD) and the other is the output of market sentiment (do we BUY, SAVE or BORROW).. as such they move in similiar directions but at different times. Think of them as connected by a slinky. I believe that investors do not react logically to market events (markets were never originally designed to be impacted by media or the internet) and constantly underreact and overreact as they struggle to comprehend newsflow. This is fair - there is too much information for any of us to process.

2. The 'W' shape - the reality is that describing markets via shapes is a pointless past time that has made a lot of technical folks a lot of money.. they sell you illustrations that make you feel better about what markets are doing - easy phrases that people can hook onto. They are nothing more than a narrative of what has happened and a pretty poor tool for anything else. The only thing I'm interested in is whether people believe the pundits, how many and where people may herd to next. In reality this small correction feels a bit like one back in 2004 (not to say it's the same) - people get jittery and cash their profits.. the sales flows across the mutual industry point towards this since as far back as October-November (see chart below).. the market has paused to take stock.. this is normal market behaviour folks, markets are supposed to go up AND down. Recent investor surveys also point to a lack of confidence for 2010 - investors often call this the '2nd phase' of a bull market.. it's typified by lower headline returns but strong income flow bolstered by a stronger economy and corporate profits. Economic data already looks much better for Q409 (E.g. UK - Unemployment down, purchasing up, CPI up, retail sales up, credit conditions stable..)


It's funny because until the summer of 2009 the media really didn't talk about a recovery or a 'bull market' - we were still processing recession data. This is often why the first phase of a market recovery is a called a 'stealth bull market'.. I call it this because it happens without the populous being truly aware of it. The Investment industry too was slow to pick-up - investment houses go into such a cycle of cost-cutting that the rarely spot the 'bounce'.. if you want a novelle contrarian idea for investing then base it around the product development cycle of asset managers..

3. Lastly - are prices too high? Again there is no real marker as to whether a market has ovverun or not - yes - we have historical prices but as we know the world markets have grown by some crazy % since the 1950s so comparisons are again largely used as placebos. Any given point is either oversold or under-sold depending on your point of view. We do not know what markets will do today, let alone tomorrow or the next.. 'Experts' may like to tell you otherwise - many will show you very compelling trendings, forecasting and 'clever' math (be in no doubt there are a lot of clever people trying to work these conundrums out). I've talked about volatility swings becoming more rapid and more severe - this notion of up and down returns (useless fact for the day - clever bods call it brownian notion) is like the oscillation of a spectrum analyser http://en.wikipedia.org/wiki/Spectrometer the drawdown we saw in 2008 was unprecedented and the rate of recovery through 2009 has been (almost as) equally pronounced.

If you remember back to physics @ school then you will remember how oscillations tend to rise and fall in waves - a large down is folowed by a large up which then gradually subsides then grows again. So if that was true of investment markets then perhaps the recovery in 2009 was too pronounced - a reaction to 2008 which was a reaction to the market of 2007... 2006,, 2005.. If following that logic then we could see a zig-zag market that gradually stabilises. These are sometimes called 'frothy' markets and actually pose lots of opportunity (and risk) for active investors. The Talinn Institute of Cybernetics has lots of clever bods who look at oscillation patterns and market volatility.. the most useful thing from our point of view is that volatility is rarely symmetrical or predictable - why? because people don't behave logically. For further reading then consider Taleb's 'The Black Swan', David Stamp's 'The Market Prophets' or  inded Kahnemann's study into investor behaviour.. all stimulating for the grey stuff..!
I haven't sat down properly with the charts but it feels intuitively that the rate of inclimb since March has been much steeper and faster than that from March 2003-Jan 2004. This of course may mean nothing, nada, zip.. but it could also mean that the market has priced 2 years of recovery in 1.. bull runs of course don't last foreever - eventually the expectation of profit dwindles and investors cash out to protect what they have already made. This may be what we are seeing now but what is clear(ish) to me is that investors are far more sensitive to information than ever before. Of course a lot of money is still run by powerful institutions who do not react in the same way and they may be able to counter-balance some of the 'herding' patterns or encourage it to their own benefit.. Bull runs tend to last about 3 years and bears about 18 months but as we have seen there are no rules to be made or broken here.. markets are uncertain.

So if market movements were based on the 0.001% of the clever people in the world who do the trading, the lending and the investing then things should be quite easy to figure out.... Wrong!!

The fact of the matter is that every investor/worker wakes up and hopes to make money (or keep money) - there is a certain amount of money that can go around and that amount should be the total wealth of the world divided by the sum of those in it. BUT without sounding Marxist - the fact of the matter is that we are mostly engrained to want more than our lot - this is the forebear of capitalism, the American dream, and the Marx's division of wealth.

Thus to make money in markets means that someone not unlike you had to lose.. you just made 20%; well done - someone else just lost 20%.. To be blunt - the art of money-making requires winners and losers. Now in a growing economy we have a little thing called inflation that 'creates' more money by, in effect, making your money worth less.. this in turn incentivises people to make more.. If if wasn't like that then we wouldn't give companies money to grow their earnings but instead keep what we earn in cash, under the matress.. Alas then inflation is something of a neccessary evil as inflation also grows the capital of companies who can then borrow to spend, to employ, to grow earnings, to return that money back to you.. with profit. To grow earnings people need to also be encouraged to spend..too borrow, too save.. to then spend again..[supply-demand blah blah blah.. Adam Smith would be proud].

I reallly do wish that modern markets followed the conventional economic model or that I could use 17th century Japanses charts (Kagi, Renka) to predict that supply-demand as a means to buy/sell.. the problem is too much information, it's why 'EMH' (Efficient Market Hypothesis, the bedrock of finance) is such a bloody misnomer.. but also why; in a sort of mutated way, markets are so hard to beat, so hard to predict or profit from. (ok, my head hurts)..

So when you decide whether to BUY or SELL - just remember that someone has made the opposite decision; banking on you making that decision. The market also never stops - even when there is no trading - advanced computer systems are continually recalculating positions, opportunities for the next day - global timezones means someone is usually buying something; somewhere. Some markets never stop pricing and the advent of HFT (High Frequency Trading) makes this even more scary - 000000s of trades per second.. becoming faster.. algo-based systems processing information before we have processed it ourselves.. Perhaps investment markets/economies are the only true form of AI (artificial intelligence) -like the internet its network is limitless.. every peice of information (inc this blog) can have an effect but when information leads to an investment trade then its imapct is material - IT LIVES!!. Like a weather system the ripple effect is virtually impossible to predict but unlike weather the markets don't even follow laws of physics.. it's both mechanical (systems) and organic (people).. This is why some market bods are turning to organic mechanics to try and understand markets better. Good luck I say.

What's my point - not a lot I guess - simply that the wheels of the market will keep going around regardless and that our ability to predict what it will do next is pretty useless. It's chicken or the egg - do investors react to markets, markets to investors: or both..

So what do we do?

1. Stop being too focussed on the daily media (aka 'noise'). I've started allocating my assets at the weekend by which time the media has better consolidated the week's newsflow. Switch on and watch Bloomberg TV for 3 days straight for 10 hours a day during the week (I have) and you'll see what I mean..

2. Stop being too focussed on the movement of markets that often have no bearing on the returns of your portfolio.. try not to chase tails - if you had a definite plan they why change it. Set out a plan that could work in rising or falling markets.

3. Stay true to your targets - start selling/buying when you reach them. If you buy in tranches then each investment has its own timing and target - this makes investing through market changes easier. Buy when you thing something is cheaper than what you can later sell it for.

4. Be decisive - do you diversify or take risky bets? Choose and try not to overreact to markets.You won't be always right so don't try to be.. avoid compounding a mistake with another one.


right.. back off the soapbox ;)

Brucey says 'nice to see you.. nice'

Latest movements.. "I won't sell" (shorting and labra-poodles)

Great shout Obama... is the 'thought' of regulation now the precursor of risk/loss.. oh how ironic...

Anyway - being the nature of the beast is what it is (and I don't mean Obama's labra-poodle..) then I felt I was a bit exposed to both falls in the long-market (although diversified us regular UK punters tend to have to buy Sterling (our first disadvantage to the 'man').

Also my Gold positions were suffering from a little over-confidence, on my part, having profited nicely at the start of the year; I then went back in more conventionally and got stung (Blackrock's perennial ML Gold and Gneral fund). However I don't believe in crystalising losses so the loss then becomes the time it takes to recoup the assets (which in effect lowers my eventual annualised return) or in another way the compounded interest if I had held the money in cash instead..
BUT! I'm a believer in the unexpected so any asset can bounce - hence I BUY for profit, HOLD until Profit and SELL once I make profit.. I will do nothing else..
So I'm adding more short via a DB-X FTSE100 Short ETF (at a better price that my first BUY back in October I might add) amd a ETSF Gold Short to effectively neutralize those losses so that I can SELL and re-allocate. I'll track back how I get on over the next few months. If anyone has any questions on hedging then drop me a message.. I'm no expert but I can show you what I do.

In terms of regulation - well Y-Zen's Michael Maneilli (sp) is always worth a read - his view on regulation particularly refreshing! As much as I sort of support his sentiment - perhaps Obama should read his work before his next big announcement.

Monday, 18 January 2010

Sshh (Cost-Averaging doesn't always reduce Risk..)

The idea of investing via regular contributions (sometimes called cost-averaging) touched on a core flaw in the financial system - most investment providers don't adjust an investor's risk profile for cost-averaging even though it is not so different to lifecycling.. when setting goals you could think of this as 'risk-cycling' - a set of preconditions around your attitude to risk and changing targets and index levels, as markets move:


E.g. a young adventurous investor may still consider cashing profits and rotating out of equities at the height of a bull market. Often few providers make provision for this basic need; expecting advisers to pick up the 'switch' at the annual review.. but what if markets inflate mid-way and the investor or adviser don't pick it up? Investors are constantly influenced, expectations for upside and downside often change and rarely symmetrical.. sitting above 6000 in the footsie is quite differet to being below 4000 as we know.

Firstly each contribution is in effect a distinct investment - rolling them up into one 'horizon' only makes sense in terms of convenience. In reality each contribution has its own buy and sell price points (depending on the goals of the investor). In my presentation on 'horizons' ('Bull versus Bear Investing; versus Herding') I showed the impact of buying and selling at the wrong points in the market. This is no bad thing but it really does make looking at aggregated positions a bit of a farce.

Secondly cost-averaging doesn't neccessarily reduce risk anyway; it reduces immediate overall exposure, yes, as the size of investment is smaller but if you considered it a level playing field then where is the equivalent sum being held..? If the answer is that there is no single premium to invest and only a regular premium then there is no risk comparison to make. On the other hand if the sum is being held in cash or property; or another investment, then it carries its own set of risks already - whether you transfer-in or phase out - it still involves the exchange of one set of risks for another..

Lastly - worth remembering what sorts of risks you're being confronted with> Is it just market risk, concentration of portfolio risk, exposure to price volatility, credit risk, company risk, inflation risk, liquidity risk or indeed currency risk to name a few. Investing a lump sum may increase risk in some but not in others (E.g. buying at a lower point in the market for recovery or buying a US Equity Fund when the £ is strong and selling when weak)..

A key aspect of cost-averaging then is timing. On the upside conventional wisdom assumes volatility diminishes over the square root of time. This is due to the cumulative effect of returns (the so-called law of averages). However if you make seperate tranches then you, to some degree, reduce this effect and instead replace it with a form of diversification of different holding periods. There is no guarantee which method poses more risk overall, especially if you take into consideration 'extreme' volatility.

Therefore I don't want to blow up cost-averaging, as I think it at least makes people consider 'diversification' but I all too often saw it not only minimize downside but also cap upside.. if the contributions are blindly rolled over then the benefits become limited. However if used more tactically to roll in and out of positions (based on set targets) then great. Buying into troughs and phasing out of bull markets.

Be warned - regular contributions need more maintenance than a typical single premium strategy.

The CCC enters JPM's Fantasy Fund Mgr League

I have entered the CCC into JPM's Fund competition: details here:
http://jpmorgan.fantasyleague.com/


"Investing a notional £100m in JPMorgan's fund range, you'll be pitting your fund selection skills against the whole industry. Compete for great prizes. You can play on your own, or compete against your friends and colleagues in a private league. All you need to do is build and manage your portfolio to achieve the highest investment return - you really have everything to win and nothing to lose. "
First prize is £35k - any thoughts appreciated?

Sunday, 17 January 2010

Another Contrarian site (nb: always check the health warning)

Another 'contrarian' pops up.. worth a read but always check for the health warning on the packet before you light up.. ;)

http://www.investmentu.com/investment-research/Contrarian/OSA1009gen595.html?pub=OSA&code=WOSAL103

Which way is the Dollar heading.. and why does that matter for £ investors?

Lots of chat whether the Dollar will strengthen and strengthen against the £ - if that did happen then consider the impact on your portfolio. Consider also the impact on the UK economy.. vis a vis indirect impact on your portfolio. Look at the chart below - you can see why the technical investors are getting excited..


Me? I'm not decided - I struggle at the best of times to understand currency drivers no matter how many times I read them.. Forex trading always seems such a mirky pool to me; so much sentiment, so much daily trading, such tiny daily margins (unlike normal investors - traders trade currency to 4 or 5 decimal  places) so much on the US economy, deficit, imports from China and a balance of payments ranging from cr@p to apolcalyptic and that deminishing shades of 'bad' are in fact 'good'..? All quite barmy army..

Nonetheless the $:£ can be a reality for investors - I saw many investors lose money out of good funds because they were exposed to multiple currencies ($:€ and so on) - so I helped my old firm devise better risk models for seeding and investing hedged currency products to be more 'resiliant' to FX and money flows.. so wake up and smell the exchange rate folks - understand interest rate differentials and make it work for you or at least make sure you are bloody well hedged against FX risk , mitigated somehow or able to perform alchemy and avoid it altogether!!!
'Resiliance' [is a term describing how quickly the price volatility of a fund/investment normalises after an inflow/outflow]. Closely related to 'market depth' which is the susceptibility to such movements from outset.
Action plan:  Just look at your portfolio - check how it's invested, in what currency it's denominated, invested and where.. even think about where the underlying stocks or fund invest.. US/overseas - does the fund manager mitigate FX at the portfolio level. If you have an ETF then be extra sure you are not exposed to currency risk or look for currency ETFs to hedge your position or avoid ETFs that are bought in one currency and trade in another.. Just know your position and have a plan.

UK Commercial Property.... in, out - shake it all about..?

Lots of chat over commercial property again - if you're looking for a subdued asset class then this might be it - just have a look at this chart I pulled from a well known UK fund.


One thing to be wary of is the need for good corporate lending to fund new property builds, boost occupancy rates etc. So you tend to need a recovering cap spend across the market. For this we need to be sure there are no lingering effects of the market dislocation in 2008 and that banks are happy to lend for new projects. I also wonder if companies will ever again be as ambitous in the size of builds - the RBS HQ is a lesson other companies may heed. The flip side is that more companies may lease existing prime real estate rather than build their on off-site locations. I think there are opps either way.

I'm going in quite hard - I'm trying to offset Global REITs (Real Estate Investment Trusts) with UK Commercial property - both via mutual funds which immediately makes them more long-term bets. In the US a lot of recovery has already priced in: the UK looks slower and so might have more margin. Generally property tends to lag the mainstream recovery - beware the risks and buy with a clear exit plan.

Have fun..
JB

The Quandry of Wealth Managers... 'competition and cost'

"banking products all corporations can give you the same (current account, TD, funds....etc), so services of wealth management is the difference that can allow you to compete in this market. What kind of services, not only pure market services as portfolio management but also other complementary as legal advise, inheritance planning ( an execution with lawyers....etc)"

As you know I'm all for transparency of charges and justifying how they are charged. The idea of setting universal standards for wealth services has its appeal.

The problem: 'Commoditising' and hence price competing ancillary wealth services is that they increase operating costs and on simple economies of scale this would favour the larger firms over the smaller wealth managers/advisers. Why?
Simple economics: However; generally speaking, the larger the wealth manager then the more akin to a DAM it becomes and I think the personal connection becomes diluted. Until that can be addressed then I am wary of making anything other than KYC and investment acumen the root of a wealth offering. It needs to be a fair and level playing field: at which point setting universal standards and costs for services makes great sense. We need to keep competion open and for many smaller firms that means sub-contracting legal and tax professionals if they are unable to keep up, in-house.
 
Overall the charges for wealth management must be justified, right across the offering, as great ancillary services can't mask sloppy portfolio management and visa versa. Intuitively - bundling feels wrong to me.


Thursday, 14 January 2010

ETFs - one thing to think about..how to 'short'

A traditional ETF doesn't short its position so is always what we call 'long'..which means you are exposed if prices fall. Active managers on the other hand may short (and increasingly doing so) but you have no control over how much; (outside of the investment mandate/policy) nor how well they will hedge their position.

If you do chose an ETF then consider buying a corresponding 'short' ETF - it won't be geared so you can only buy corresponding units - think then of it more as either a way to mitigate (not remove) loss if markets do fall.. or as seperate investments that will cash in at different periods depending on market direction (a bit like a poor man's market neutral strategy)

Always remember the time horizon of each investment and stick to your BUY and SELL targets.

Food for thought.
JB

A handy gadget for Iphone/touch users.. try 'Hypocalc'.

In the 2nd half of last year I helped consult Appsrocket in the design of a simple financial modeller. My former colleague and owner of AppsRocket aptly named it 'HypoCalc'.


Web 2.0 applications are new genre that has grown exponentially in the last year, sparked primarily by the launch of Apple's IPhone. Although it had its challenges I'm sure you'll agree the results are worth it. My idea of a simple approach allows the user to select a different level of expected risk on the upside/downside while using the traditional bell curve range of expected returns. Although still bell-curve-derived; HypoCalc allows the user to change the confidence levels so that the expected range of return isn't symmetrical.. as we know - investment return is rarely symmetrical..!

By changing the level of expected upside and downside, volatility, expected return and investment horizon - the investor can start to consider hypothetical scenarios against their attitude to investment risk.

I'm really happy that HypoCalc is finally live on the Apps store for Iphone/Itouch users and congratulate Mahyad and Appsrocket on this achievement. From my pov it furthers education among normal and professional investors and I hope that we can develop more ideas together.

I'd recommend HypoCalc as a first step tool for all CCC'ers..

Go to: http://www.appsrocket.com/

Wednesday, 13 January 2010

Money on the move again - BUT where is Japan heading?

2009 was quite frustrating for me - the equity index levels at the bottom of the last trough were clearly underpriced and sentiment driven (as were YTMs on High Yield and EM bonds) - recession woes had a firm grip and of course liquidity was even more scarce then; than salt is now to clear my driveway from ice..! And so my pension transfer arrived late (October) and I missed the party.. Asia and EM Mkts were up and even the footsie has made easy double-digit returns.. doh! I consoled myself with some small gains in metals which I posted a few weeks back.


In terms of growth since March 2009 then Asian Equities already looked expensive - Emerging Mkt momentum into bonds/equities accelerated into Q4. However IF the UK's IMA numbers for November are replicated across Europe then I suspect that support has already slowed; IMA showed a fairly large rotation into Cautious Managed funds). What is clear is that assets are on the move again and rotating. If we look at the latest confidence indices then these appear to have fallen back by December; (still well above 2008 but down nonetheless) - the 'herd' seemed to be taking stock of the strong recovery and perhaps profit-taking on the assumption of a sluggish 2010; (similiar to 2004).


Lipper FERI are among the best trackers of sales flows in the world and I have the priviledge of working with them closely over the years. Their Asia coverage and research is becoming especially good.

Here is a link to their latest bulletin: http://www.lipperfmi.com/FERIFMI/Information/Files/FFAsia%200911%20Nov.pdf
I'll start tracking the performance and sales flow movment for Japan funds for your benefit.

"Japanese savers moved aggressively into Real Estate, higher-yielding bonds and the more racey equity sectors.. China, Hong Kong and Japan were in fact the only exception to Asia’s one consistent theme — the nearwholesale reluctance to invest in equities. In these three markets, the overwhelming bulk of new money went into Chinese stock funds" FERI
Q. If the Japanese are not buying Japanese Equities then why should we? The answer could be currency play of Yen..?

BUT a New Year and those end of year blues may give way to a new bull market. IF we see strong 'recovery' indicators for Q1; and supportive media, then there is no reason to assume anything other than the normal 2-3 bull market. What is perhaps plausible is that the bull market will not last as long simply because the previous drawdown occured and corrected faster than usual. This is in keeping with my earlier view that cyclical volatility will become more extreme due to the increase of investor information, greater private investor controls, de-institutionalisation of assets, globalisation and the rise of high frequency trading.

So what of Japan and is it a BUY or indeed heading down to China town?

A misnomer? Japan has always traded somewhat out of sync with its neighbours and indeed US/Europe. Primarily this has been much to do with the industrial make-up of Japan and it's unqiue inflation cycle and banking set-up. Japanese financial policy and political volatility have driven a weak Yen, which in turn fuelled the Yen carry-trade - for me this has been used excessively by outside investors/banks to keep the Yen weak. It has been the convenient source of easy liquidity to grow markets. However now Japanese banks are  strong again; (if a shadow of their former pre-97 glory).


The economics of Japan are complex and not entirely convincing - too much for me without some saki; and sometimes I don't think anyone really knows why Japan is out of sync with its neighbours. As China, India and Korea become more influential as trading partners within the ASEAN sector then perhaps that legacy won't last forever.

As one Hargreaves analyst wrote recently.. "After 53 years of single party dominance the market is still searching for firm direction from the newly elected Democratic Party of Japan. Will they be able to deliver the changes set out in their campaign? The jury is still very much out, and many in Japan remain sceptical. Nonetheless, in contrast with the previous government, the new Prime Minister has stressed the importance of deepening ties with other countries, notably China. This is a sign that Japan might become more fully integrated into Asia, which could be positive for many Japanese firms in the long term. Despite its problems, I think Japan still possesses the ingredients for a potential bull market: Low valuations, growth in mergers and acquisitions (Panasonic has just bought 50% of Sanyo for example) and a recovery in company earnings. I remain of the opinion that Japan will eventually have its time in the sun. What is still unclear is what the catalyst will be for market sentiment to improve."


So - simple says - for me Japan's TOPIX looks cheap at 3-5 yr levels - I am prepared to sit out for a cpl of years for a 20-30% recovery, vested via a cheap ETF. I am less certain of tier 2 smaller companies and so have opted for the main index; (the discount looks similiar). The one risk I haven't taken into account is Sterling v Yen and perhaps based on my notes above I should focus on the Yen rather than the stocks..


Monday, 4 January 2010

Picking funds in 2 easy steps.. wouldn't that be nice>?!

The article extracted below is written by John Coumarianos who is a fund analyst with Morningstar and editor of Morningstar's monthly newsletter that offers independent guidance on the fund family and helps investors find the best American funds. It is well written, anecdotal and fairly conventional among diversification, time horizon views - prevalent amidst media and advisers alike.. Posted to M'Star's site it is public knowledge and fair game for the CCC imo.

To read in full: http://news.morningstar.com/articlenet/article.aspx?id=321017&pgid=rss

Do you agree; personally I am less confident of historical patterns but I often catch myself buying for recovery. Hey - I am an ashamed multiple-personality investor? So in general I can still appreciate John's sentiment if not his on-the-fence conclusion (suspect we can thank M'Star for that).

The M'Star headline read:
'Two Things to Consider Before Picking Funds: Think about your goals, and learn about market history.'

"The appropriate place for money that you'll spend within two years is in cash--a money-market fund or a certificate of deposit. For a time horizon of two to three years, you can consider a conservative short-term bond fund or an ultrashort bond fund. Anything else is too risky. Then you must be prepared to see the return on that investment lag many other choices. In fact, it's virtually guaranteed that some asset class or sector funds will dramatically outperform that money-market account safeguarding next year's tuition payment or down payment for a house. Learn to live with the fact that returns on short-term money may look weak next to alternatives.
In short, getting the best possible returns on that money isn't the point; protecting it from loss is more important. Certainty comes at a price.
 
Over the long haul, stocks have been better performers than money markets and short-term bond funds, but they're no panacea. Knowing market history can help you build a successful long-term portfolio that neither overdoses on stocks nor avoids them altogether.

Stocks have returned about 10% annually for nearly a century, but they can go through extended periods of very poor performance. For example, the S&P 500 Index has posted a cumulative loss of 8% for this decade through Dec. 28, 2009, while the BarCap US Aggregate Bond Index has posted a more pleasing 85% return over that time. Additionally, stocks produced virtually no return from the period beginning in the mid-1960s through the early 1980s. Use this grim knowledge to set and temper your expectations.
Knowing what stocks have returned over the longer haul, and knowing that they can disappoint over multidecade periods, can also help you keep saving appropriately. Don't count on a roaring stock market to bail you out of not having saved enough for retirement or another major financial goal. Then, if the next decade for stocks turns out to be a great one, that will be icing on the cake. "

Friday, 1 January 2010

HNY: Bonds, bonds, bond yields.. North or South?

Firstly Happy New Year dear fellow CCC'ers..

To kick off I picked up on this bond discussion from one of the global wealth forums. Thought I'd post here for consideration.
Question: Is a secular bear market in bonds about to start? We are witnessing many fundamental and technical factors to suggest this including but not limited to an unsustainable expansion in the US monetary base and unprecedented amount of buying in the US Treasury and Corporate bond markets as stock market participants flee in droves. Technically, the 30-year US Treasury bond yield chart has put in a breakdown failure on the yearly chart after a consolidation in yields from 2002-2007. A move north of the yield highs of 2008-09 in 2010 would turn the trend up and start the secular bear. (see http://research.stlouisfed.org/fred2/graph/?s[1][id]=AMBNS )
Now there's a question - lots of talk about the fair value of bonds. I'm always cynical of technical indicators unless the 'herd' believes them (or I make them up myself).. but always open to chart patterns that emerge.


Where will yields go? - hard to say - prices will fall so most yields on existing issues will head north but what of new placings - the capital squeeze looks less severe, the need to raise capital less - I don't see (much) need for companies to give up high yields unless they need to restructure their debt; (we may see shifts in the SWAPS market for example). Sovereigns on the other hand have large deficits and every need to rob Peter to pay Paul. Investor sentiment will stabilise and we'll likely return to sth like a 2004 bond market. Tight but so-so efficient and relatively stable.. that would support a new equity market if we follow the events of 2003-2006.

In terms of buying patterns then, globally, the 'money' has already begun to rotate out of bonds - it is pricing for a decline. What's confusing the market is that institutions have had lots of capital in reserve since 2008 and are now investing it; (this is one of the few occassions where the average investor has little power over short term market direction). Be aware - any large influx of money will facilitate the greatest change in secondary market prices in bond markets.. bond traders will continue to do what they do.. I suspect behind the institutional injection; investors are moving away from bonds.

Just be ready to move to capitalise/defend your portfolios.

JB
Quote of the day: "Great spirits have always found violent opposition from mediocrities. The latter cannot understand it when a man does not thoughtlessly submit to hereditary prejudices but honestly and courageously uses his intelligence." Albert Einstein (attributed)

Investment U


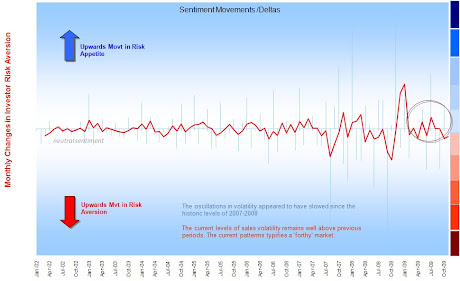
Delta changes in risk aversion (Nov09)

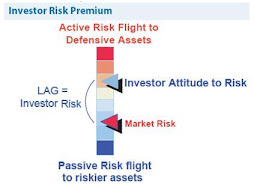
Sentiment: The 'Lag' Effect

Sentiment: The 'Lag' Effect
Investor perception of risk is rarely up to date

Global Consciousness Project (GCP) 'Dot'

The Global Consciousness Project collects random numbers from around the world. This is a real time data analysis of the GCP. It collects the data each minute and runs statistics on the stream of random numbers generated by the project. This analysis is run 10 minutes behind the generation of the data. In this way, it can be seen as a real-time indicator of global consciousness coherence. http://gcp.djbradanderson.com/ BLUE DOT: Significantly small network variance. Suggestive of deeply shared, internally motivated group focus. The index is above 95% BLUE-GREEN DOT: Small network variance. Probably chance fluctuation. The index is between 90% and 95% GREEN DOT: Normally random network variance. This is average or expected behavior. The index is between 40% and 90% YELLOW DOT: Slightly increased network variance. Probably chance fluctuation. The index is between 10% and 40% AMBER DOT: Strongly increased network variance. May be chance fluctuation, with the index between 5% and 10% RED DOT: Significantly large network variance. Suggests broadly shared coherence of thought and emotion. The index is less than 5% The probability time window is one hour. For a more information on the algorithm you can read about it on the GCP Basic Science page

Choosing Mutual Funds..

Choosing a Mutual Fund – CLUE “it is not about past performance.." You could try - Logic Scoring! The trick is to create your own metrics and populate them into your own grid.. Always remember to test your assumptions v outcomes: your model may be right but you may find what you thought to be a SELL is actually a BUY. Always look at the problem in the mirror! You can also read this in conjunction with my guide on Value at Risk and other Key Risk Indicators below. http://tinyurl.com/ydvf3zh

Bull versus Bear Investing; versus Herding

The lifecycle (or holding period) of an investment held by a particular investor, often categorised as short, medium or long-term.

Let's get normal volatility out of the way first.. VaR-based toolkit.

Ok - a starting point - let's get normal volatility out of the way first.. This pack was written around end Q308 - post 16/8 but before the massive movement of Oct-Nov08. For those who support brownian motion or the geometric movement of returns then, I'm afraid to say, it's going to end bad..

What is the fuss with volatility.....

Re the movement of market returns - many believe they follow a geometric or exponential Brownian motion ('GBM') which is a continuous-time stochastic process in which the logarithm of the randomly varying quantity follows a Brownian motion, also called a Wiener process. It is used particularly in the field of option pricing because a quantity that follows a GBM may take any positive value, and only the fractional changes of the random variate are significant ('deltas').

http://en.wikipedia.org/wiki/Geometric_Brownian_motion


So in practice 'brownian motion' assumes a strong tendency to trend - it says that returns won't jump from day 1 to day 2 but move up and down in fairly predictable increments.. the returns of the previous days have an impact on the subsequent day - they are not unique. This estimation of how prices move is the underlying principal for the future pricing of derivatives contracts such as options.. i.e. E.g. to buy a contract, at one price, to buy or sell the underlying asset at a future date at a future price... this is usually referred to as the 'Black-Scholes formula' or the much much earlier Bronzin model (1908). This ties up with the old-age 'law of big numbers' (or law of averages) - where returns follow a pattern around a mean and that the volatility around that mean diminishes over time.. Where those returns are then assumed to form a normal distribution (or bell curve) then the 'GBM' is symmetrical to the mean of those returns. BUT what if we do not believe upside and downside returns will be similiar?.
A LOT of analysis has been run since to dispel this view such as many variations of the the Noble winner Robert Engle's ARCH approach in 2003 ('heteroskedasticity'.. or the analysis of different dispersions/volatilities), countless variations thereof, stochastic models (see below*), extreme loss analysis, stress testing, scenario analysis and so on - it keeps the Math boys busy shall we say...

*Stochastic models: treat the underlying security's volatility as a random process, governed by variables such as the price level of the underlying, the tendency of volatility to revert to some long-run mean value, and the variance of the volatility process itself, among others. Somtimes I use Markov chain as the easiest way to visualise and understand a random process: usually it's illustrated by the cat and the mouse:

Suppose you have a timer and a row of five adjacent boxes, with a cat in the first box and a mouse in the fifth one at time zero. The cat and the mouse both jump to a random adjacent box when the timer advances. E.g. if the cat is in the second box and the mouse in the fourth one, the probability is one fourth that the cat will be in the first box and the mouse in the fifth after the timer advances. When the timer advances again, the probability is one that the cat is in box two and the mouse in box four. The cat eats the mouse if both end up in the same box, at which time the game ends. The random variable K gives the number of time steps the mouse stays in the game..

This Markov chain then has 5 states:

State 1: cat in the first box, mouse in the third box: (1, 3)
State 2: cat in the first box, mouse in the fifth box: (1, 5)
State 3: cat in the second box, mouse in the fourth box: (2, 4)
State 4: cat in the third box, mouse in the fifth box: (3, 5)
State 5: the cat ate the mouse and the game ended: F.

To show this for a fairly infinite number of price movements is somewhat less achievable but nonetheless that's what the clever bods have done..

Otherwise most of probability, I admit, is above my head unless it descends into some sort of practical application - BUT I get the sub-plot.. stop trying to predict future patterns from regressing past performance... show me the track record of a model (after it has been created) and I'll be one step closer to being converted.. I'll touch on stress testing, extreme analysis ('extremistan') and scenarios another day..

"The Black–Scholes model disagrees with reality in a number of ways, some significant. It is widely employed as a useful approximation, but proper application requires understanding its limitations -blindly following the model exposes the user to unexpected risk. In short, while in the Black–Scholes model one can perfectly hedge options by simply Delta hedging, in practice there are many other sources of risk." Wikpedia

http://en.wikipedia.org/wiki/Black%E2%80%93Scholes


Active-Passive Investing Debate

Performance Patterns: **This deck is based on some work-based research so apologies for the confusing arguments - as a consequence the 'story' in the slides is a little muddy so I will re-jig this in the New Year to make my points clearer.** Passive-active purchase drivers in the UK are less differentiated/defined than perhaps elsewhere; the basic rules apply: What I did find was that there were interesting herding flows preceding, into and of the credit crunch. These were large asset-class movements: something which active managers would have little control of unless they ran absolute return type startegies. What my analysis showed is that an investor could manage a passive portfolio tactically to take advantage of large herding patterns. This involves risk, access to the right data, practice and above all discipline but I hope it will be a journey we can share!!

Lessons for 2010 - REIT Funds

Noting the events around 2005-2008 make for interesting considerations when thinking about buying REIT Funds in 2010..

The UK Investor - The Surprise Factor

The maps in the presentation (below) really help illustrate the suprise factor of the credit crunch.. little of the previous patterns would prepare the UK investor for what was about to come. The flows show that investors did not recognise the risks inherent in 2006-2008. This is because the industry uses conventional fund metrics, which were at best outputs not guides..!

The UK Investor - IMA 'Map' 2002-2008

Jon Beckett, ASCI - Past Projects (2003-2008)

I have been involved in the IFA and investment market since 1998, covering a broad range of roles. I have engaged a number of industry bodies over the years, to be a voice for change, to reform our industry and make it trusted and respected. None of the projects shown should be related to Franklin Templeton either: explicit, inferred or otherwise. I attach some of my past projects from 2004-2008.. Rgds JB