Clown Consortium for Contrarians: A place for free-thinkers to swap investment ideas and challenge conventional wisdom. All views are independent and do not represent those of any organisation or employer.


Thursday, 17 December 2009
The old Active-Passive debate trundles on..
Ahh the good old active-passive debate is back in 2009 - simply put 'active' means giving your money to a fund manager or stockbroker to invest for you and you pay them a fee against the hope of better returns. Plan B is to buy simpler products that replicate the market indices (also known as beta).
What has re-energised this debate is the expansion of Exchange Traded Funds ('ETFs').. You may or may not have heard of these but one of the best known are 'IShares'.. (created by Barclays; sold to Blackrock).. In the US the Vanguard brand really cracked the market wide-open in 2008 to become one of the largest investment managers.. and they are expanding overseas.
Before we consider the performance patterns of ETFs.. One of the first points I want to make (something we'll pick up later) is the issue of fee structures and industry business models used for mutual funds. They rely on 'sticky assets'.. i.e. the investor leaves the money with the manager for a period longer than 1 year. To encourage this they often add redemption fees to nullify profits and generally make it harder for average investors to redeem over short time periods. It is interesting to note that the division of wealth at play here between the common 'A' share versus 'I' class investors: the haves and have-nots). So what does the average investor do?
What's changed? Firstly I think ETFs offer genuine options for investors through low cost trading and redemption fees, which for the first time allow investors to be more tactical without being exposed to single stock risk etc. A chance to buy pure index, transparently. Secondly that notion of 'transparency' has also been very strong out in Asia and to a lesser extent in Europe/UK - it departs from complex 'black box' strategies where the risks can be hidden.. in favour of simple index and no-catch g'teed products. Although the risks in an index can still surprise; there is more expectation of the mechanics plus instant visibility down to individual stock level. For the Internet generation tracking an investment shouldn't be easier.
Meanwhile Active and Managed fund managers have been busily creating defences to compare costs over longer time periods. This has been largely propaganda and misses the point. Fact: the common mutual fund income model is designed around a reoccurring annual charge (the 'AMC') that is blind of the performance of the investor's portfolio. Many hedge fund managers have based their fees on performance (waterlines, fulcrums) and have had to such is the volatility in their returns but also as a way to increase revenues for above-target performance.
Performance related fees aside; the only path open to active managers is to prove their counter-cyclical prowess, consistently - to outperform the market over key time horizons. The problem with this is that few do and consistently over time. I continue to believe that if managrs moved to performance-linked fees then investors would be more willing to wait for recovery - as is fees levied on top of losses only compounds investor frustration!
The obvious downside to index buying is the cyclical and unexpected nature of the markets themselves - the ETF will track up and down markets faithfully. In the middle of 2 cycles index buyers often find their portfolios have made no positive returns - this encourages a more tactical and disciplined approach; (rather than the time-old buy and hold aka 'fire and forget').
The good news is that it is becoming increasingly easy to buy index funds across a range of risk categories and asset types. Coupled to a disciplined tactical approach can be profitable; the onus moves onto the quality of information available to the investor and the buy and sell points (also known as the investment horizon).
Less obvious downsides - liquidity risk - any index tracking product will react to large changes in trading volume; an active manager can short adverse movements or diversify. BUT again these can also be done through building an active asset allocation around ETFs.
I will continue posting around these themes over the coming weeks.. stay tuned!
Investment U

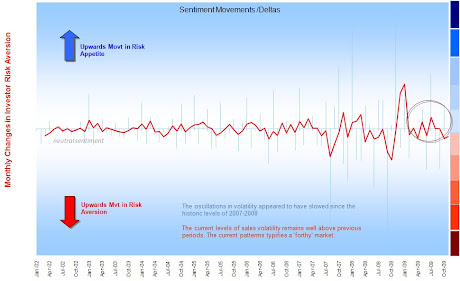
Delta changes in risk aversion (Nov09)
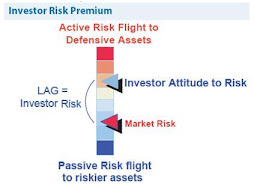
Sentiment: The 'Lag' Effect

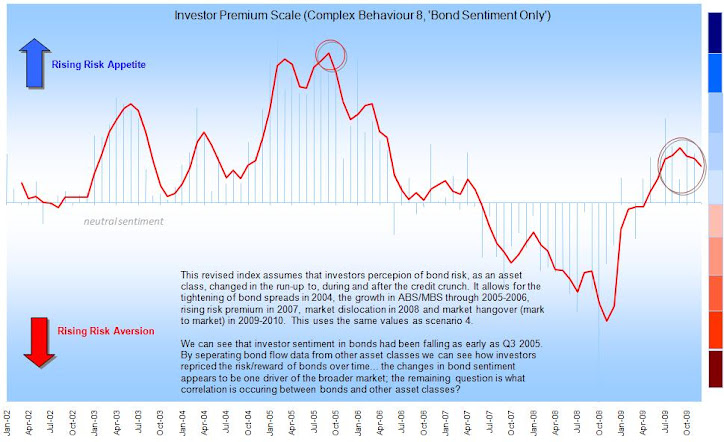
Investor perception of risk is rarely up to date
Global Consciousness Project (GCP) 'Dot'
Choosing Mutual Funds..
Bull versus Bear Investing; versus Herding
Let's get normal volatility out of the way first.. VaR-based toolkit.
What is the fuss with volatility.....
http://en.wikipedia.org/wiki/Geometric_Brownian_motion
*Stochastic models: treat the underlying security's volatility as a random process, governed by variables such as the price level of the underlying, the tendency of volatility to revert to some long-run mean value, and the variance of the volatility process itself, among others. Somtimes I use Markov chain as the easiest way to visualise and understand a random process: usually it's illustrated by the cat and the mouse:
This Markov chain then has 5 states:Suppose you have a timer and a row of five adjacent boxes, with a cat in the first box and a mouse in the fifth one at time zero. The cat and the mouse both jump to a random adjacent box when the timer advances. E.g. if the cat is in the second box and the mouse in the fourth one, the probability is one fourth that the cat will be in the first box and the mouse in the fifth after the timer advances. When the timer advances again, the probability is one that the cat is in box two and the mouse in box four. The cat eats the mouse if both end up in the same box, at which time the game ends. The random variable K gives the number of time steps the mouse stays in the game..
State 1: cat in the first box, mouse in the third box: (1, 3)
State 2: cat in the first box, mouse in the fifth box: (1, 5)
State 3: cat in the second box, mouse in the fourth box: (2, 4)
State 4: cat in the third box, mouse in the fifth box: (3, 5)
State 5: the cat ate the mouse and the game ended: F.
To show this for a fairly infinite number of price movements is somewhat less achievable but nonetheless that's what the clever bods have done..
Otherwise most of probability, I admit, is above my head unless it descends into some sort of practical application - BUT I get the sub-plot.. stop trying to predict future patterns from regressing past performance... show me the track record of a model (after it has been created) and I'll be one step closer to being converted.. I'll touch on stress testing, extreme analysis ('extremistan') and scenarios another day..
http://en.wikipedia.org/wiki/Black%E2%80%93Scholes"The Black–Scholes model disagrees with reality in a number of ways, some significant. It is widely employed as a useful approximation, but proper application requires understanding its limitations -blindly following the model exposes the user to unexpected risk. In short, while in the Black–Scholes model one can perfectly hedge options by simply Delta hedging, in practice there are many other sources of risk." Wikpedia
Active-Passive Investing Debate
Performance Patterns: **This deck is based on some work-based research so apologies for the confusing arguments - as a consequence the 'story' in the slides is a little muddy so I will re-jig this in the New Year to make my points clearer.** Passive-active purchase drivers in the UK are less differentiated/defined than perhaps elsewhere; the basic rules apply: What I did find was that there were interesting herding flows preceding, into and of the credit crunch. These were large asset-class movements: something which active managers would have little control of unless they ran absolute return type startegies. What my analysis showed is that an investor could manage a passive portfolio tactically to take advantage of large herding patterns. This involves risk, access to the right data, practice and above all discipline but I hope it will be a journey we can share!!
Lessons for 2010 - REIT Funds
The UK Investor - The Surprise Factor
The maps in the presentation (below) really help illustrate the suprise factor of the credit crunch.. little of the previous patterns would prepare the UK investor for what was about to come. The flows show that investors did not recognise the risks inherent in 2006-2008. This is because the industry uses conventional fund metrics, which were at best outputs not guides..!
No comments:
Post a Comment
Note: only a member of this blog may post a comment.