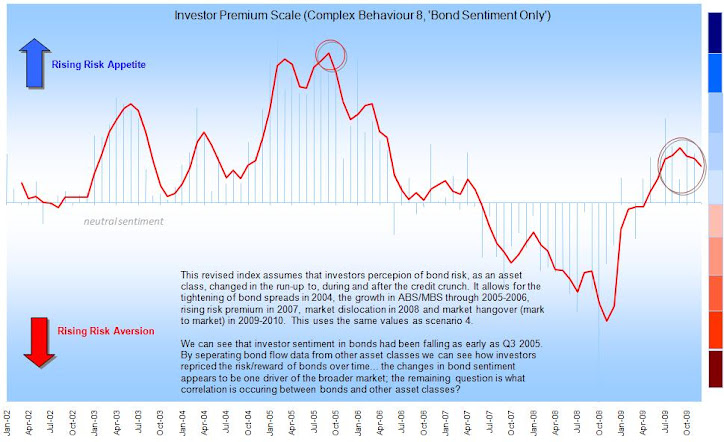
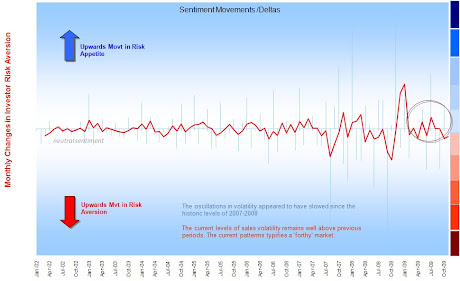
The idea of something being 'cheap' often relies on a historical yard-stick - the mean return of a fund, stock or index for example. This is actually quite different to 'value' buying which is all about comparing the current market (or dirty) price of an investment against the intrinsic (underlying/expected) net asset value. One looks backwards; the other forwards. So recovery is not about value but about 'reversion to mean' - here is the S&P chart - to the left shows the current position in 2008 as was at the time (early Q408) iirc. The top-line message and key facts delivered the neccessary punch and you can assume this message was broadcast to millions of investors at the end of 2008 (directly or indirectly to pensions and fund managers). What we now know is that the market did indeed bottom around November 2008. - what seems less certain is why..
Unprecedented Market Conditions: S&P 500 (1825 – 2008)
Positive Years: 70%
Most Common Result: 0-10%
(Over 24% of the times)
Since 1927 the S&P 500 annualised return is 6%
Just in 1931 and YTD 2008 the S&P 500 performed below -40%The assumption was that this would carry into market products such as ETFs (index) and active mutual funds. Below we see the expectation of recovery: historical mean versus current position.
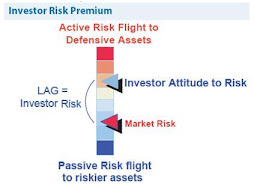
Contrarian view: What if markets rallied on the assumption that markets had to rebound because of their position to the mean and not on fundamentals? Certainly they rallied well before economic recovery was fully recognised; (as they so often do). Raising capitalisations fuel balance sheets, capex, spending, inflation and employment. Talk now of a 'W' shaped recovery then may be seen as the symptom that perhaps markets herded too soon into a bull market; falling confidence may precipitate a drawdown. What we need is to see the money flow.. and measure sentiment changes corresponding.
Conventional view: “ Histograms are useful graphical descriptions for quantitative variables in large data sets. They break the range of the values of a variable into intervals and display only the frequency (or relative frequency) of the observations that fall into each interval.”


.jpg)


No comments:
Post a Comment
Note: only a member of this blog may post a comment.