Sunday, 17 January 2010

UK Commercial Property.... in, out - shake it all about..?

Lots of chat over commercial property again - if you're looking for a subdued asset class then this might be it - just have a look at this chart I pulled from a well known UK fund.


One thing to be wary of is the need for good corporate lending to fund new property builds, boost occupancy rates etc. So you tend to need a recovering cap spend across the market. For this we need to be sure there are no lingering effects of the market dislocation in 2008 and that banks are happy to lend for new projects. I also wonder if companies will ever again be as ambitous in the size of builds - the RBS HQ is a lesson other companies may heed. The flip side is that more companies may lease existing prime real estate rather than build their on off-site locations. I think there are opps either way.

I'm going in quite hard - I'm trying to offset Global REITs (Real Estate Investment Trusts) with UK Commercial property - both via mutual funds which immediately makes them more long-term bets. In the US a lot of recovery has already priced in: the UK looks slower and so might have more margin. Generally property tends to lag the mainstream recovery - beware the risks and buy with a clear exit plan.

Have fun..
JB

The Quandry of Wealth Managers... 'competition and cost'

"banking products all corporations can give you the same (current account, TD, funds....etc), so services of wealth management is the difference that can allow you to compete in this market. What kind of services, not only pure market services as portfolio management but also other complementary as legal advise, inheritance planning ( an execution with lawyers....etc)"

As you know I'm all for transparency of charges and justifying how they are charged. The idea of setting universal standards for wealth services has its appeal.

The problem: 'Commoditising' and hence price competing ancillary wealth services is that they increase operating costs and on simple economies of scale this would favour the larger firms over the smaller wealth managers/advisers. Why?
Simple economics: However; generally speaking, the larger the wealth manager then the more akin to a DAM it becomes and I think the personal connection becomes diluted. Until that can be addressed then I am wary of making anything other than KYC and investment acumen the root of a wealth offering. It needs to be a fair and level playing field: at which point setting universal standards and costs for services makes great sense. We need to keep competion open and for many smaller firms that means sub-contracting legal and tax professionals if they are unable to keep up, in-house.
 
Overall the charges for wealth management must be justified, right across the offering, as great ancillary services can't mask sloppy portfolio management and visa versa. Intuitively - bundling feels wrong to me.


Thursday, 14 January 2010

ETFs - one thing to think about..how to 'short'

A traditional ETF doesn't short its position so is always what we call 'long'..which means you are exposed if prices fall. Active managers on the other hand may short (and increasingly doing so) but you have no control over how much; (outside of the investment mandate/policy) nor how well they will hedge their position.

If you do chose an ETF then consider buying a corresponding 'short' ETF - it won't be geared so you can only buy corresponding units - think then of it more as either a way to mitigate (not remove) loss if markets do fall.. or as seperate investments that will cash in at different periods depending on market direction (a bit like a poor man's market neutral strategy)

Always remember the time horizon of each investment and stick to your BUY and SELL targets.

Food for thought.
JB

A handy gadget for Iphone/touch users.. try 'Hypocalc'.

In the 2nd half of last year I helped consult Appsrocket in the design of a simple financial modeller. My former colleague and owner of AppsRocket aptly named it 'HypoCalc'.


Web 2.0 applications are new genre that has grown exponentially in the last year, sparked primarily by the launch of Apple's IPhone. Although it had its challenges I'm sure you'll agree the results are worth it. My idea of a simple approach allows the user to select a different level of expected risk on the upside/downside while using the traditional bell curve range of expected returns. Although still bell-curve-derived; HypoCalc allows the user to change the confidence levels so that the expected range of return isn't symmetrical.. as we know - investment return is rarely symmetrical..!

By changing the level of expected upside and downside, volatility, expected return and investment horizon - the investor can start to consider hypothetical scenarios against their attitude to investment risk.

I'm really happy that HypoCalc is finally live on the Apps store for Iphone/Itouch users and congratulate Mahyad and Appsrocket on this achievement. From my pov it furthers education among normal and professional investors and I hope that we can develop more ideas together.

I'd recommend HypoCalc as a first step tool for all CCC'ers..

Go to: http://www.appsrocket.com/

Wednesday, 13 January 2010

Money on the move again - BUT where is Japan heading?

2009 was quite frustrating for me - the equity index levels at the bottom of the last trough were clearly underpriced and sentiment driven (as were YTMs on High Yield and EM bonds) - recession woes had a firm grip and of course liquidity was even more scarce then; than salt is now to clear my driveway from ice..! And so my pension transfer arrived late (October) and I missed the party.. Asia and EM Mkts were up and even the footsie has made easy double-digit returns.. doh! I consoled myself with some small gains in metals which I posted a few weeks back.


In terms of growth since March 2009 then Asian Equities already looked expensive - Emerging Mkt momentum into bonds/equities accelerated into Q4. However IF the UK's IMA numbers for November are replicated across Europe then I suspect that support has already slowed; IMA showed a fairly large rotation into Cautious Managed funds). What is clear is that assets are on the move again and rotating. If we look at the latest confidence indices then these appear to have fallen back by December; (still well above 2008 but down nonetheless) - the 'herd' seemed to be taking stock of the strong recovery and perhaps profit-taking on the assumption of a sluggish 2010; (similiar to 2004).


Lipper FERI are among the best trackers of sales flows in the world and I have the priviledge of working with them closely over the years. Their Asia coverage and research is becoming especially good.

Here is a link to their latest bulletin: http://www.lipperfmi.com/FERIFMI/Information/Files/FFAsia%200911%20Nov.pdf
I'll start tracking the performance and sales flow movment for Japan funds for your benefit.

"Japanese savers moved aggressively into Real Estate, higher-yielding bonds and the more racey equity sectors.. China, Hong Kong and Japan were in fact the only exception to Asia’s one consistent theme — the nearwholesale reluctance to invest in equities. In these three markets, the overwhelming bulk of new money went into Chinese stock funds" FERI
Q. If the Japanese are not buying Japanese Equities then why should we? The answer could be currency play of Yen..?

BUT a New Year and those end of year blues may give way to a new bull market. IF we see strong 'recovery' indicators for Q1; and supportive media, then there is no reason to assume anything other than the normal 2-3 bull market. What is perhaps plausible is that the bull market will not last as long simply because the previous drawdown occured and corrected faster than usual. This is in keeping with my earlier view that cyclical volatility will become more extreme due to the increase of investor information, greater private investor controls, de-institutionalisation of assets, globalisation and the rise of high frequency trading.

So what of Japan and is it a BUY or indeed heading down to China town?

A misnomer? Japan has always traded somewhat out of sync with its neighbours and indeed US/Europe. Primarily this has been much to do with the industrial make-up of Japan and it's unqiue inflation cycle and banking set-up. Japanese financial policy and political volatility have driven a weak Yen, which in turn fuelled the Yen carry-trade - for me this has been used excessively by outside investors/banks to keep the Yen weak. It has been the convenient source of easy liquidity to grow markets. However now Japanese banks are  strong again; (if a shadow of their former pre-97 glory).


The economics of Japan are complex and not entirely convincing - too much for me without some saki; and sometimes I don't think anyone really knows why Japan is out of sync with its neighbours. As China, India and Korea become more influential as trading partners within the ASEAN sector then perhaps that legacy won't last forever.

As one Hargreaves analyst wrote recently.. "After 53 years of single party dominance the market is still searching for firm direction from the newly elected Democratic Party of Japan. Will they be able to deliver the changes set out in their campaign? The jury is still very much out, and many in Japan remain sceptical. Nonetheless, in contrast with the previous government, the new Prime Minister has stressed the importance of deepening ties with other countries, notably China. This is a sign that Japan might become more fully integrated into Asia, which could be positive for many Japanese firms in the long term. Despite its problems, I think Japan still possesses the ingredients for a potential bull market: Low valuations, growth in mergers and acquisitions (Panasonic has just bought 50% of Sanyo for example) and a recovery in company earnings. I remain of the opinion that Japan will eventually have its time in the sun. What is still unclear is what the catalyst will be for market sentiment to improve."


So - simple says - for me Japan's TOPIX looks cheap at 3-5 yr levels - I am prepared to sit out for a cpl of years for a 20-30% recovery, vested via a cheap ETF. I am less certain of tier 2 smaller companies and so have opted for the main index; (the discount looks similiar). The one risk I haven't taken into account is Sterling v Yen and perhaps based on my notes above I should focus on the Yen rather than the stocks..


Monday, 4 January 2010

Picking funds in 2 easy steps.. wouldn't that be nice>?!

The article extracted below is written by John Coumarianos who is a fund analyst with Morningstar and editor of Morningstar's monthly newsletter that offers independent guidance on the fund family and helps investors find the best American funds. It is well written, anecdotal and fairly conventional among diversification, time horizon views - prevalent amidst media and advisers alike.. Posted to M'Star's site it is public knowledge and fair game for the CCC imo.

To read in full: http://news.morningstar.com/articlenet/article.aspx?id=321017&pgid=rss

Do you agree; personally I am less confident of historical patterns but I often catch myself buying for recovery. Hey - I am an ashamed multiple-personality investor? So in general I can still appreciate John's sentiment if not his on-the-fence conclusion (suspect we can thank M'Star for that).

The M'Star headline read:
'Two Things to Consider Before Picking Funds: Think about your goals, and learn about market history.'

"The appropriate place for money that you'll spend within two years is in cash--a money-market fund or a certificate of deposit. For a time horizon of two to three years, you can consider a conservative short-term bond fund or an ultrashort bond fund. Anything else is too risky. Then you must be prepared to see the return on that investment lag many other choices. In fact, it's virtually guaranteed that some asset class or sector funds will dramatically outperform that money-market account safeguarding next year's tuition payment or down payment for a house. Learn to live with the fact that returns on short-term money may look weak next to alternatives.
In short, getting the best possible returns on that money isn't the point; protecting it from loss is more important. Certainty comes at a price.
 
Over the long haul, stocks have been better performers than money markets and short-term bond funds, but they're no panacea. Knowing market history can help you build a successful long-term portfolio that neither overdoses on stocks nor avoids them altogether.

Stocks have returned about 10% annually for nearly a century, but they can go through extended periods of very poor performance. For example, the S&P 500 Index has posted a cumulative loss of 8% for this decade through Dec. 28, 2009, while the BarCap US Aggregate Bond Index has posted a more pleasing 85% return over that time. Additionally, stocks produced virtually no return from the period beginning in the mid-1960s through the early 1980s. Use this grim knowledge to set and temper your expectations.
Knowing what stocks have returned over the longer haul, and knowing that they can disappoint over multidecade periods, can also help you keep saving appropriately. Don't count on a roaring stock market to bail you out of not having saved enough for retirement or another major financial goal. Then, if the next decade for stocks turns out to be a great one, that will be icing on the cake. "

Friday, 1 January 2010

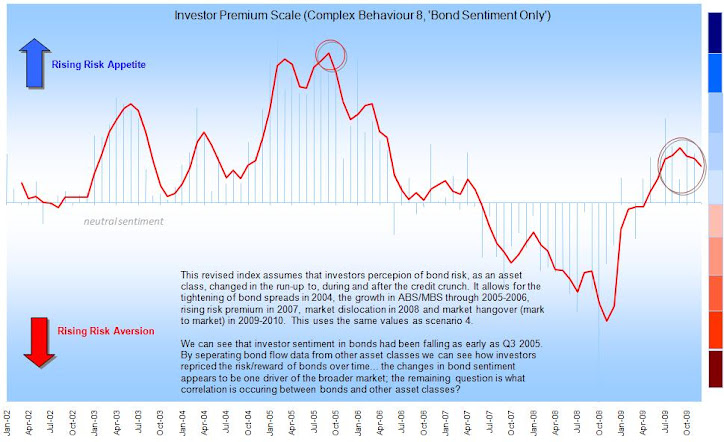
HNY: Bonds, bonds, bond yields.. North or South?

Firstly Happy New Year dear fellow CCC'ers..

To kick off I picked up on this bond discussion from one of the global wealth forums. Thought I'd post here for consideration.
Question: Is a secular bear market in bonds about to start? We are witnessing many fundamental and technical factors to suggest this including but not limited to an unsustainable expansion in the US monetary base and unprecedented amount of buying in the US Treasury and Corporate bond markets as stock market participants flee in droves. Technically, the 30-year US Treasury bond yield chart has put in a breakdown failure on the yearly chart after a consolidation in yields from 2002-2007. A move north of the yield highs of 2008-09 in 2010 would turn the trend up and start the secular bear. (see http://research.stlouisfed.org/fred2/graph/?s[1][id]=AMBNS )
Now there's a question - lots of talk about the fair value of bonds. I'm always cynical of technical indicators unless the 'herd' believes them (or I make them up myself).. but always open to chart patterns that emerge.


Where will yields go? - hard to say - prices will fall so most yields on existing issues will head north but what of new placings - the capital squeeze looks less severe, the need to raise capital less - I don't see (much) need for companies to give up high yields unless they need to restructure their debt; (we may see shifts in the SWAPS market for example). Sovereigns on the other hand have large deficits and every need to rob Peter to pay Paul. Investor sentiment will stabilise and we'll likely return to sth like a 2004 bond market. Tight but so-so efficient and relatively stable.. that would support a new equity market if we follow the events of 2003-2006.

In terms of buying patterns then, globally, the 'money' has already begun to rotate out of bonds - it is pricing for a decline. What's confusing the market is that institutions have had lots of capital in reserve since 2008 and are now investing it; (this is one of the few occassions where the average investor has little power over short term market direction). Be aware - any large influx of money will facilitate the greatest change in secondary market prices in bond markets.. bond traders will continue to do what they do.. I suspect behind the institutional injection; investors are moving away from bonds.

Just be ready to move to capitalise/defend your portfolios.

JB
Quote of the day: "Great spirits have always found violent opposition from mediocrities. The latter cannot understand it when a man does not thoughtlessly submit to hereditary prejudices but honestly and courageously uses his intelligence." Albert Einstein (attributed)

Investment U


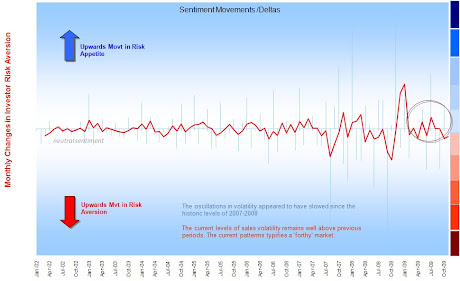
Delta changes in risk aversion (Nov09)

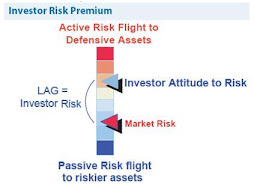
Sentiment: The 'Lag' Effect

Sentiment: The 'Lag' Effect
Investor perception of risk is rarely up to date

Global Consciousness Project (GCP) 'Dot'

The Global Consciousness Project collects random numbers from around the world. This is a real time data analysis of the GCP. It collects the data each minute and runs statistics on the stream of random numbers generated by the project. This analysis is run 10 minutes behind the generation of the data. In this way, it can be seen as a real-time indicator of global consciousness coherence. http://gcp.djbradanderson.com/ BLUE DOT: Significantly small network variance. Suggestive of deeply shared, internally motivated group focus. The index is above 95% BLUE-GREEN DOT: Small network variance. Probably chance fluctuation. The index is between 90% and 95% GREEN DOT: Normally random network variance. This is average or expected behavior. The index is between 40% and 90% YELLOW DOT: Slightly increased network variance. Probably chance fluctuation. The index is between 10% and 40% AMBER DOT: Strongly increased network variance. May be chance fluctuation, with the index between 5% and 10% RED DOT: Significantly large network variance. Suggests broadly shared coherence of thought and emotion. The index is less than 5% The probability time window is one hour. For a more information on the algorithm you can read about it on the GCP Basic Science page

Choosing Mutual Funds..

Choosing a Mutual Fund – CLUE “it is not about past performance.." You could try - Logic Scoring! The trick is to create your own metrics and populate them into your own grid.. Always remember to test your assumptions v outcomes: your model may be right but you may find what you thought to be a SELL is actually a BUY. Always look at the problem in the mirror! You can also read this in conjunction with my guide on Value at Risk and other Key Risk Indicators below. http://tinyurl.com/ydvf3zh

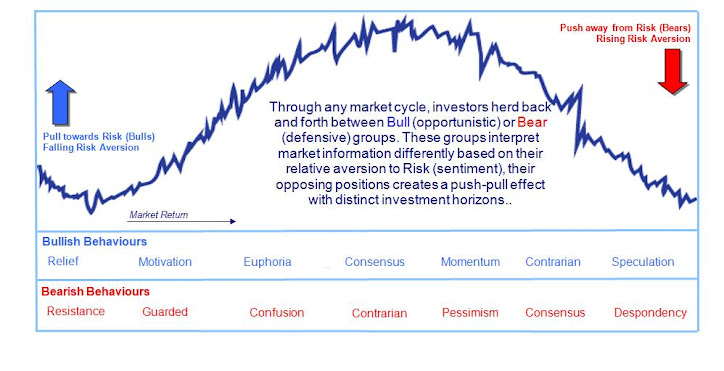
Bull versus Bear Investing; versus Herding

The lifecycle (or holding period) of an investment held by a particular investor, often categorised as short, medium or long-term.

Let's get normal volatility out of the way first.. VaR-based toolkit.

Ok - a starting point - let's get normal volatility out of the way first.. This pack was written around end Q308 - post 16/8 but before the massive movement of Oct-Nov08. For those who support brownian motion or the geometric movement of returns then, I'm afraid to say, it's going to end bad..

What is the fuss with volatility.....

Re the movement of market returns - many believe they follow a geometric or exponential Brownian motion ('GBM') which is a continuous-time stochastic process in which the logarithm of the randomly varying quantity follows a Brownian motion, also called a Wiener process. It is used particularly in the field of option pricing because a quantity that follows a GBM may take any positive value, and only the fractional changes of the random variate are significant ('deltas').

http://en.wikipedia.org/wiki/Geometric_Brownian_motion


So in practice 'brownian motion' assumes a strong tendency to trend - it says that returns won't jump from day 1 to day 2 but move up and down in fairly predictable increments.. the returns of the previous days have an impact on the subsequent day - they are not unique. This estimation of how prices move is the underlying principal for the future pricing of derivatives contracts such as options.. i.e. E.g. to buy a contract, at one price, to buy or sell the underlying asset at a future date at a future price... this is usually referred to as the 'Black-Scholes formula' or the much much earlier Bronzin model (1908). This ties up with the old-age 'law of big numbers' (or law of averages) - where returns follow a pattern around a mean and that the volatility around that mean diminishes over time.. Where those returns are then assumed to form a normal distribution (or bell curve) then the 'GBM' is symmetrical to the mean of those returns. BUT what if we do not believe upside and downside returns will be similiar?.
A LOT of analysis has been run since to dispel this view such as many variations of the the Noble winner Robert Engle's ARCH approach in 2003 ('heteroskedasticity'.. or the analysis of different dispersions/volatilities), countless variations thereof, stochastic models (see below*), extreme loss analysis, stress testing, scenario analysis and so on - it keeps the Math boys busy shall we say...

*Stochastic models: treat the underlying security's volatility as a random process, governed by variables such as the price level of the underlying, the tendency of volatility to revert to some long-run mean value, and the variance of the volatility process itself, among others. Somtimes I use Markov chain as the easiest way to visualise and understand a random process: usually it's illustrated by the cat and the mouse:

Suppose you have a timer and a row of five adjacent boxes, with a cat in the first box and a mouse in the fifth one at time zero. The cat and the mouse both jump to a random adjacent box when the timer advances. E.g. if the cat is in the second box and the mouse in the fourth one, the probability is one fourth that the cat will be in the first box and the mouse in the fifth after the timer advances. When the timer advances again, the probability is one that the cat is in box two and the mouse in box four. The cat eats the mouse if both end up in the same box, at which time the game ends. The random variable K gives the number of time steps the mouse stays in the game..

This Markov chain then has 5 states:

State 1: cat in the first box, mouse in the third box: (1, 3)
State 2: cat in the first box, mouse in the fifth box: (1, 5)
State 3: cat in the second box, mouse in the fourth box: (2, 4)
State 4: cat in the third box, mouse in the fifth box: (3, 5)
State 5: the cat ate the mouse and the game ended: F.

To show this for a fairly infinite number of price movements is somewhat less achievable but nonetheless that's what the clever bods have done..

Otherwise most of probability, I admit, is above my head unless it descends into some sort of practical application - BUT I get the sub-plot.. stop trying to predict future patterns from regressing past performance... show me the track record of a model (after it has been created) and I'll be one step closer to being converted.. I'll touch on stress testing, extreme analysis ('extremistan') and scenarios another day..

"The Black–Scholes model disagrees with reality in a number of ways, some significant. It is widely employed as a useful approximation, but proper application requires understanding its limitations -blindly following the model exposes the user to unexpected risk. In short, while in the Black–Scholes model one can perfectly hedge options by simply Delta hedging, in practice there are many other sources of risk." Wikpedia

http://en.wikipedia.org/wiki/Black%E2%80%93Scholes


Active-Passive Investing Debate

Performance Patterns: **This deck is based on some work-based research so apologies for the confusing arguments - as a consequence the 'story' in the slides is a little muddy so I will re-jig this in the New Year to make my points clearer.** Passive-active purchase drivers in the UK are less differentiated/defined than perhaps elsewhere; the basic rules apply: What I did find was that there were interesting herding flows preceding, into and of the credit crunch. These were large asset-class movements: something which active managers would have little control of unless they ran absolute return type startegies. What my analysis showed is that an investor could manage a passive portfolio tactically to take advantage of large herding patterns. This involves risk, access to the right data, practice and above all discipline but I hope it will be a journey we can share!!

Lessons for 2010 - REIT Funds

Noting the events around 2005-2008 make for interesting considerations when thinking about buying REIT Funds in 2010..

The UK Investor - The Surprise Factor

The maps in the presentation (below) really help illustrate the suprise factor of the credit crunch.. little of the previous patterns would prepare the UK investor for what was about to come. The flows show that investors did not recognise the risks inherent in 2006-2008. This is because the industry uses conventional fund metrics, which were at best outputs not guides..!

The UK Investor - IMA 'Map' 2002-2008

Jon Beckett, ASCI - Past Projects (2003-2008)

I have been involved in the IFA and investment market since 1998, covering a broad range of roles. I have engaged a number of industry bodies over the years, to be a voice for change, to reform our industry and make it trusted and respected. None of the projects shown should be related to Franklin Templeton either: explicit, inferred or otherwise. I attach some of my past projects from 2004-2008.. Rgds JB