Saturday, 27 March 2010

Diversifying: A rant about VaR

Setting your risk budget, trying to understand the 'downside' of an investment..and diversify those risks.. these are all reasonable questions when investing. In the last few years many have turned to Value at Risk analysis ('VaR') as an answer.

What is it with Value at Risk analysis... People do seem to forget how distribution stats work and the simple fact they are 'confidence' models... when talking to friends and colleagues I like trying to flip the confidence around into betting odds.. 1 in 20, in 200 etc.. this seems to give folks a better understanding of the probable (the likely 90, 95% etc) and the less probable.

Confidence: I found it hilarious that folks mistook: '1 in 200 chance of x event over 1 year, as a '1 in 200 year event'.. this is a very schoolboy error; (one prevalent across actuarial circles). Game-theorists aside: the odds of 1 in 200 are the same in every year.. the size of that risk is also not known, it falls outside our confidence (i.e. we don't know). Some reported experiencing 1 in 200 year events for the last 3 years.. clearly that's not right?!


Downside and Diversification.. VaR is used mainly for 2 things: to gauge the likely 'downside' of an investment and as a way to budget that risk. The problem is that most VaR is based on historical returns BUT what the investor gets back rarely matches the marketed standard time period returns. Once folks thought they had found someone who could but he turned out to be running a Ponzi scheme..

Let's ignore forward VaR (ex-ante, stochastic models) as that treads into forecasting and I haven't the energy to talk about crystal balls for one night!

Getting back to setting out risk for the investor - most are advised to diversify, why? The schema of diversification, and how it's presented, is so wrapped-up in spin that it's debatable science. It's the investment houses that tell us to diversify, why, because their revenue models are based around long-term assets.. tactical investing is seen as an unstable force: (i.e. bad for annual management fees). Yes - short term herding can be quite destructive and Fidelity's Magellan study showed investors rarely profited but that's down to education and of course confidence: investment houses treat customer assets as their own, once allocated. It's for the adviser and the investor to remind them otherwise, set specific investment horizons and targets.
As someone who has worked both sides of the fence: I found that financial risk and investing does not lie inside VaR or any Math model for that matter.
 
 "I can calculate the motion of heavenly bodies, but not the madness of people." Isaac Newton
The investors who seem to win more than they lose don't appear to do anything complex. They seem to start by knowing they'll lose and play the long game. In short they rely on the illogic of others to do the work for them. They play the behavioural card.
"We simply attempt to be fearful when others are greedy and to be greedy only when others are fearful." "You only have to do a very few things right in your life so long as you don't do too many things wrong." Warren Buffett
"Bull markets are born in pessimism, grow on skepticism, mature on optimism, and die of euphoria."-- Sir John Templeton
"The market can stay irrational longer than you can stay solvent."-- John Maynard Keynes

Perhaps the lessons to be learned here is not invest by looking at performance-based risk at all but by stepping back and looking at other factors involved. I hope to pick up on some of these in my new paper 'Clown Thinking and the financial Media Circus'. JB
Monday, 22 March 2010

The CCC: A new name, a new way of thinking?

Dear CCC'ers - in light of my forthcoming paper 'Clown Thinking and the financial media Circus'.. I thought it only fitting to change the name of the CCC to the:

'Clown Consortium for Contrarians'

I hope in the coming weeks/months to explain what clown thinking is and why it's good to be a clown.

JB

Double Trouble: Bubble or Dip

Hi All,
If you look back at my behaviours timeline: here we see what I'd call the 'tipping point' between bulls and bears.. for the 13 months the bulls had been gaining ground at a faster rate than most previous bull cycles (think of it has the counter-swing to one of the fastest/pronounced market drawdowns in history)..

Perhaps this is the 'Obama effect', the result of excessive central bank stimulus.. or '2 years growth in 1'.. when you look at it that way the current market becomes a different prospect.. BUT momentum has slowed in the last 6; barring a recent surge.Take then an article by Rodney Hobson, Author, Shares Made Simple and Small Companies, Big Profits: The headline reads:
'Double bubble' "There are odd nuggets of welcome news on the economic front. The message remains that while we are not yet out of the woods, it could be a lot worse.."
The headline and article don't add-up; Rodney's article is full of balanced views, caveats BUT it's as if the editor re-rote his headline to grab maximum attention. Here is clear evidence of the Media Circus at play.

Bears continue to tout the 'double dip' paranoia; now Bulls have resurrected the notion of the 'double bubble' to keep the advantage and get traction back in the market again. So,

'Double Bubble or Double Dip'? In my experience any market cycle that has been punctuated by 2 bulls rallies tended to mean one thing.. risk aversion is falling (too low?), morale hazzard and complacency is creeping in (as we all now believe we live in a safer; more regulated state) and risk is rising. The Media Circus is again turning the wheels and set to speed up!

This change in 'consensus' in the market could be echoed by the Global Consciousness Project (GCP) 'Dot'. Of late I have seen amber and yellow dots, as currentrly. "YELLOW DOT: Slightly increased network variance. Probably chance fluctuation." The Global Consciousness Project collects random numbers from around the world. This is a real time data analysis of the GCP. It collects the data each minute and runs statistics on the stream of random numbers generated by the project. This analysis is run 10 minutes behind the generation of the data. In this way, it can be seen as a real-time indicator of global consciousness coherence. I have yet to back-test the confidence in the GCP versus sales flow (investor) behaviours.

Of course I don't know what direction markets will take; nor does the GCP, much will depend on the Media Circus and which camp the herd believes. Now as before, as it will be..

Your faithful clown
JB

Saturday, 20 March 2010

New paper - draft in 4 weeks.. 'Clown Thinking and the Media Circus'

Evening All,
Tonight I started penning thoughts and research to paper; together with various influences, in what I'll call 'Clown Thinking and the Media Circus'.. stay tuned..

This will be Paper 1 in my 'Finance on the Front Line' series for the CCC. It will benefit from the input of many great people I have met in the world of Risk and Finance. In time I hope to build this into my PhD proposal/research.

Once the draft has gone through various iterations; edited, and feedback, from 10 chosen wisemen, incorporated then I will duly share here with my fellow CCC'ers..!

From today, I hope to have the first working draft ready in 4 weeks, edits in 5, feedback in 6 and on here in 7..!! I juts hope folks don;t find it too boring.. it will be a real test for my writing ability.

Once done I can then start my Masters studies (CISI, Module1) in earnest..

Monday, 15 March 2010

CAS: Network indices v sales flow behaviour - the missing measurable?

An interesting revelation - could mobile network indices trigger stock market changes? This question has been posed elsewhere; merits consideration.
'Do you use wireless network stat doing research? The links/queries among cellular technology, computer science and social science. Research shows that human behavior is 93% predictable:( http://www.sciencemag.org/cgi/content/abstract/327/5968/1018 ). Scientists studied anonymous cell-phone users's mobility patterns and concluded that. If cell-phone user penetration is over 95% in certain countries/areas, what is the over all predicability?
'A range of applications, from predicting the spread of human and electronic viruses to city planning and resource management in mobile communications, depend on our ability to foresee the whereabouts and mobility of individuals, raising a fundamental question: To what degree is human behavior predictable? Here we explore the limits of predictability in human dynamics by studying the mobility patterns of anonymized mobile phone users. By measuring the entropy of each individual’s trajectory, we find a 93% potential predictability in user mobility across the whole user base. Despite the significant differences in the travel patterns, we find a remarkable lack of variability in predictability, which is largely independent of the distance users cover on a regular basis.'
Wireless engineers use massive data collected by cellular network to design and optimize the network. Have we think about human behaviours when we design the network? ( we may, but not enough.)


I used to watch event impacts to network traffic patterns which seemed telling me all the stories. I tried to image what happend 30 miles or 1000 miles away.  Sometimes we are anxious waiting economic data, public censue to be release in the morinings. Isn't celluar network statistic more accurate to reflect human behavior, economics and social science results?


I believe if we dig deep enough, some cellular network indices should trigger stock market changes. If one area is picked as research objective, the celluar data should be able to tell you the most recent and historic rapidly then any database.Do the current 2G/3G data foresee 4G pathes? Will you develop real time optimizazation tool to using predicable human behavior pattern? 93% is pretty high accuracy for wireless tecnology, computer sciences and especially for economic and social science.'
Entropy: I've been talking a while about working out the patterns of sales flows as a complex adaptive system ('CAS'). This would combine variances in sales patterns against variances in media flow. What I was lacking was communication.. a way to measure not only the 'noise' of media influences but the resulting 'chatter' of investor reaction; leading to finally the herding of sales flows.. perhaps amplified through High Frequency Trading ('HFT') and growth of 3G, as they take hold of the global markets.

John Marke has talked about the lack of 'slack' in the system and it might be possible to map out an end-to-end system for this. Suddenly this looks doable. JB

Sunday, 14 March 2010

Contrarians: Dr Mark Mobius (aka 'Bald Eagle')

JB on Mobius: During my time at Franklins I had the pleasure of speaking with MM a few times, tracking, analysing and selling his funds, and managing his S&P ratings and securing his first 'AAA' for his flasgship Templeton Asian Growth Fund. In 2008 he kindly signed his book for me.. It's fair to say I rate him as a fund manager in the same ilk as Buffet, Templeton etc.. perhaps more so as he really did set into motion the Emerging Markets investment fund.. the cascade effects are very evident now. This article caught my eye.

http://timesbusiness.typepad.com/money_weblog/2009/06/mark-mobius-ten-top-investment-tips.html
'Dr Mark Mobius is one of the most experienced fund managers in the industry.  He has been managing the Templeton Emerging Markets Investment Trust since its launch 20 years ago. In that time the value of an investment in the trust has multiplied more than eleven times.
Here Dr Mobius draws on his years of experience to offer ten investment tips to Money Central readers.'
1. Keep an eye on value
Is a share selling for below its book value? What is the relationship between the earnings and the price?
2. Don’t follow the herd
Many of the most successful investors are contrarian investors. Buy when others are selling and sell when others are buying.
3. Be patient
Rome was not built in a day and companies take time to grow to their full potential.
4. Dripfeed your money into the market
No one knows exactly where markets are going so dripfeed your money into the market by making regular investments. That way you will average out the ups and downs of the market.
5. Examine your own situation and your appetite for risk
You should not go into equities if you are the type of person who is nervous every time you read a stock market report.
6. Diversify your portfolio
You must never put all your eggs in one basket unless you have a lot of time to watch that basket - and most of us don’t.
7. Don’t listen to your friends or neighbours when it comes to investment decisions
Your own situation is different from everyone else’s so you should be making the decisions.
8. Don’t believe everything you read in newspapers, things tend to be exaggerated
Don’t be swayed by headlines and look at what is going on behind the scenes.
9. Go into emerging markets because that is where the growth is
 Emerging markets have consistently grown much faster than the developed countries in virtually every year since 1988.
10. Look at countries where populations are young Countries with young populations are going to be the most productive in future years.

Happy Birthday Albert!

Happy Brithday Albert..

To mark the occassion I have added an attributed citation as the quote for the day.. sums up pretty much everything the CCC is about and stands for.. curiosity!

"Great spirits have always found violent opposition from mediocrities. The latter cannot understand it when a man does not thoughtlessly submit to hereditary prejudices but honestly and courageously uses his intelligence." A.E.

Wednesday, 10 March 2010

CFA seminar.. January sales flow data in...

Back from an enjoyable evening with the CFA chaps - another hour of CPD logged!
Gavyn Davies presenting on macro and economic policy errors through the credit crunch, and current state, at the Scotsman hotel. I threw in a question at the end about the 'potential for a gilt downgrade being bad medicine for the UK': yes any downgrade would be bad in terms of confidence and via rising yields would put up the cost of UK's borrowing. However surely this current state of AAA in doubt can't be helping foreign investment, especially with ratings agencies issuing alerts. I posed whether a downgrade would stabilise the credit risk premium and attract investment. I guess a downgrade is still seen as the greater of 2 evils (knowing how investors can panic and media hype) but it'll be interesting if BoE and HMT try to sell more issues: in effect I'd assume they'll resort to increasingly longer issues with increasing yield/YTM to entice takers... we'll see. 
Back to business: another month's worth of sales flow data to digest, I need to get my numbers together so I can formulate some ideas back to John Marke (ref Complex Adaptive Systems).

I also want to pull in a CISI article re HFT - seems I'm not the only one to have concerns after all.

Jon-out!

Sunday, 7 March 2010

Latest herding patterns - quick observations

Hi CCC'ers,
Apologies for the delay in this post; I had an interview last week which distracted me (went okay-ish - see my ppt proposal entitled 'Do Funds Do What they Say') and I've been reading John Marke's paper on resilience and complexity. I promised some quick analysis of the latest sales flows patterns and make some simple notes on what they tell us. This month I will also do a deeper analysis of the sales flow patterns, run correlation, look for gammas etc. Fow now et voici!

Latest herding patterns across Europe/Offshore - what can we derive from them - some quick observations?

Overall: It's still a '50:50' market out there; the herd is in a tipping balance between a second dip or a continuing recovery. Their buying habits typify a lot of undecision and uncertainty (funds like absolute return and structured do well during these times), which the media is feeding off. Add to this the doubts over sovereign downgrades, banks and the cash-heavy positions of wholesale institutions and it's all a bit messy out there really. In terms of sectors:

Big winners in December: Asset allocation, EM Bonds, EM Equity, Eq Euroland, Eq Europe, Eq Global, Eq Grt China (helped by some new launches), Mixed Assets Balanced.

Big losers in December: FofF Short-term Dynamic, a huge rotation away from Cash/MM, Bonds EUR Short-term.

Latest data: Pros v Cons:

Positives:
  1. Sentiment is still cautious but the pessimism in early Q4 appeared to have settled a bit by the December flows.
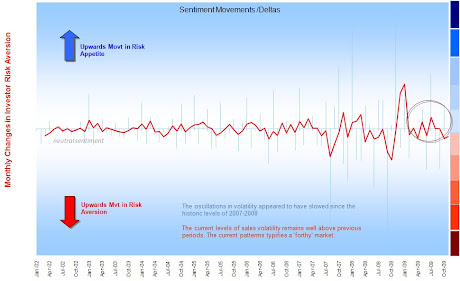
  2. The deltas tell us the water was calming a little - far from a mill pond but it's getting closer to the normal sort of movements we have seen since 2002.
Negatives:
  1. Setiment is still south of neutral - disappointing given the influx of positive (albeit mixed) economic data. The 'W-shape' doom merchants are doing a good job at persuading the herd that more downside is to come.
  2. We know there was a lot of media activity in Q1 2010 so we will need to see how that's played out in the sales flows.
Quote of the day: "Great spirits have always found violent opposition from mediocrities. The latter cannot understand it when a man does not thoughtlessly submit to hereditary prejudices but honestly and courageously uses his intelligence." Albert Einstein (attributed)

Investment U


Delta changes in risk aversion (Nov09)

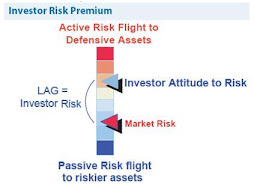
Sentiment: The 'Lag' Effect

Sentiment: The 'Lag' Effect
Investor perception of risk is rarely up to date

Global Consciousness Project (GCP) 'Dot'

The Global Consciousness Project collects random numbers from around the world. This is a real time data analysis of the GCP. It collects the data each minute and runs statistics on the stream of random numbers generated by the project. This analysis is run 10 minutes behind the generation of the data. In this way, it can be seen as a real-time indicator of global consciousness coherence. http://gcp.djbradanderson.com/ BLUE DOT: Significantly small network variance. Suggestive of deeply shared, internally motivated group focus. The index is above 95% BLUE-GREEN DOT: Small network variance. Probably chance fluctuation. The index is between 90% and 95% GREEN DOT: Normally random network variance. This is average or expected behavior. The index is between 40% and 90% YELLOW DOT: Slightly increased network variance. Probably chance fluctuation. The index is between 10% and 40% AMBER DOT: Strongly increased network variance. May be chance fluctuation, with the index between 5% and 10% RED DOT: Significantly large network variance. Suggests broadly shared coherence of thought and emotion. The index is less than 5% The probability time window is one hour. For a more information on the algorithm you can read about it on the GCP Basic Science page

Choosing Mutual Funds..

Choosing a Mutual Fund – CLUE “it is not about past performance.." You could try - Logic Scoring! The trick is to create your own metrics and populate them into your own grid.. Always remember to test your assumptions v outcomes: your model may be right but you may find what you thought to be a SELL is actually a BUY. Always look at the problem in the mirror! You can also read this in conjunction with my guide on Value at Risk and other Key Risk Indicators below. http://tinyurl.com/ydvf3zh

Bull versus Bear Investing; versus Herding

The lifecycle (or holding period) of an investment held by a particular investor, often categorised as short, medium or long-term.

Let's get normal volatility out of the way first.. VaR-based toolkit.

Ok - a starting point - let's get normal volatility out of the way first.. This pack was written around end Q308 - post 16/8 but before the massive movement of Oct-Nov08. For those who support brownian motion or the geometric movement of returns then, I'm afraid to say, it's going to end bad..

What is the fuss with volatility.....

Re the movement of market returns - many believe they follow a geometric or exponential Brownian motion ('GBM') which is a continuous-time stochastic process in which the logarithm of the randomly varying quantity follows a Brownian motion, also called a Wiener process. It is used particularly in the field of option pricing because a quantity that follows a GBM may take any positive value, and only the fractional changes of the random variate are significant ('deltas').

http://en.wikipedia.org/wiki/Geometric_Brownian_motion


So in practice 'brownian motion' assumes a strong tendency to trend - it says that returns won't jump from day 1 to day 2 but move up and down in fairly predictable increments.. the returns of the previous days have an impact on the subsequent day - they are not unique. This estimation of how prices move is the underlying principal for the future pricing of derivatives contracts such as options.. i.e. E.g. to buy a contract, at one price, to buy or sell the underlying asset at a future date at a future price... this is usually referred to as the 'Black-Scholes formula' or the much much earlier Bronzin model (1908). This ties up with the old-age 'law of big numbers' (or law of averages) - where returns follow a pattern around a mean and that the volatility around that mean diminishes over time.. Where those returns are then assumed to form a normal distribution (or bell curve) then the 'GBM' is symmetrical to the mean of those returns. BUT what if we do not believe upside and downside returns will be similiar?.
A LOT of analysis has been run since to dispel this view such as many variations of the the Noble winner Robert Engle's ARCH approach in 2003 ('heteroskedasticity'.. or the analysis of different dispersions/volatilities), countless variations thereof, stochastic models (see below*), extreme loss analysis, stress testing, scenario analysis and so on - it keeps the Math boys busy shall we say...

*Stochastic models: treat the underlying security's volatility as a random process, governed by variables such as the price level of the underlying, the tendency of volatility to revert to some long-run mean value, and the variance of the volatility process itself, among others. Somtimes I use Markov chain as the easiest way to visualise and understand a random process: usually it's illustrated by the cat and the mouse:

Suppose you have a timer and a row of five adjacent boxes, with a cat in the first box and a mouse in the fifth one at time zero. The cat and the mouse both jump to a random adjacent box when the timer advances. E.g. if the cat is in the second box and the mouse in the fourth one, the probability is one fourth that the cat will be in the first box and the mouse in the fifth after the timer advances. When the timer advances again, the probability is one that the cat is in box two and the mouse in box four. The cat eats the mouse if both end up in the same box, at which time the game ends. The random variable K gives the number of time steps the mouse stays in the game..

This Markov chain then has 5 states:

State 1: cat in the first box, mouse in the third box: (1, 3)
State 2: cat in the first box, mouse in the fifth box: (1, 5)
State 3: cat in the second box, mouse in the fourth box: (2, 4)
State 4: cat in the third box, mouse in the fifth box: (3, 5)
State 5: the cat ate the mouse and the game ended: F.

To show this for a fairly infinite number of price movements is somewhat less achievable but nonetheless that's what the clever bods have done..

Otherwise most of probability, I admit, is above my head unless it descends into some sort of practical application - BUT I get the sub-plot.. stop trying to predict future patterns from regressing past performance... show me the track record of a model (after it has been created) and I'll be one step closer to being converted.. I'll touch on stress testing, extreme analysis ('extremistan') and scenarios another day..

"The Black–Scholes model disagrees with reality in a number of ways, some significant. It is widely employed as a useful approximation, but proper application requires understanding its limitations -blindly following the model exposes the user to unexpected risk. In short, while in the Black–Scholes model one can perfectly hedge options by simply Delta hedging, in practice there are many other sources of risk." Wikpedia

http://en.wikipedia.org/wiki/Black%E2%80%93Scholes


Active-Passive Investing Debate

Performance Patterns: **This deck is based on some work-based research so apologies for the confusing arguments - as a consequence the 'story' in the slides is a little muddy so I will re-jig this in the New Year to make my points clearer.** Passive-active purchase drivers in the UK are less differentiated/defined than perhaps elsewhere; the basic rules apply: What I did find was that there were interesting herding flows preceding, into and of the credit crunch. These were large asset-class movements: something which active managers would have little control of unless they ran absolute return type startegies. What my analysis showed is that an investor could manage a passive portfolio tactically to take advantage of large herding patterns. This involves risk, access to the right data, practice and above all discipline but I hope it will be a journey we can share!!

Lessons for 2010 - REIT Funds

Noting the events around 2005-2008 make for interesting considerations when thinking about buying REIT Funds in 2010..

The UK Investor - The Surprise Factor

The maps in the presentation (below) really help illustrate the suprise factor of the credit crunch.. little of the previous patterns would prepare the UK investor for what was about to come. The flows show that investors did not recognise the risks inherent in 2006-2008. This is because the industry uses conventional fund metrics, which were at best outputs not guides..!

The UK Investor - IMA 'Map' 2002-2008

Jon Beckett, ASCI - Past Projects (2003-2008)

I have been involved in the IFA and investment market since 1998, covering a broad range of roles. I have engaged a number of industry bodies over the years, to be a voice for change, to reform our industry and make it trusted and respected. None of the projects shown should be related to Franklin Templeton either: explicit, inferred or otherwise. I attach some of my past projects from 2004-2008.. Rgds JB