Clown Consortium for Contrarians: A place for free-thinkers to swap investment ideas and challenge conventional wisdom. All views are independent and do not represent those of any organisation or employer.
Sunday, 16 October 2011
An honest account.. thank goodness no Black Swans..!!
Saturday, 6 August 2011
S&P downgrade of US Govt credit rating.. A question of ethics?!
A debtor that hasn't defaulted is not the same as one with no default risk.
We look at the US balances and question if paying debt with another debt is sound practice. The reality is that we have treated US debt as one big blank check and that has capitalised debt down the US food chain into GSEs, Muni etc. It it marks the divide between US and the rest of the world: the level of arrogance, patriotism and naivety of the US never cease to astound!
Also I saw no intervention re S&P ratings at the tme in a Market well reported as early as 2006. As part analysts, part auditors, part media they were victims like many of us. We cannot now disparage their conservatism after having criticised their earlier liberalism. Alas I think politics will come to bare but this remains a point of independence and S&Ps status as a credible global agency not a US puppet!
On the eve of an election year, Capital hill has played political games with the global economy
Sunday, 21 November 2010
Work and things.. apologies!
Good to be back in the fund analysis game tho..
I will be back.. and soon!
JB
Wednesday, 22 September 2010
Can one truly 'diversify' through Structured Products?
It's an often used term that we see in the industry - it crops up in ETFs and Structured Products to mutual funds and managed offerings.. Structured Products, cyclically, come to the fore anytime there is uncertainty among investor sentiment (often after a good index run or when an index is trading somewhere above it's historical mean).
Diversification has always been a great seller of products - it's a term that chimes well with investors and IFAs. In short, it's a pretty abused and ambiguous term - probably not what the early inventors such as Markowitz, Fama and Sharpe had in mind for it.
Let's take a structured product - perhaps it invests over say 5 years - it splits your initial investment between a zero coupon bond to basically pay back the initial investment (as 'ZCBs' are discounted to their maturity value and pay no interest). The rest is then put into a FTSE100 option to invest for possible return over and above the g'tee. Depending on the position of the market the option may give the right to buy or sell shares at a pre-set 'strike' price. If the markets move against the option then the option premium is absorbed (loss) and the investor gets back their initial sum from the ZCB. Fair enough you might say.
But is this diversified/? True there is FTSE100 somewhere in there (on the marketing material at least) promising diversification through all 100 of the UK's biggest and brightest blue chip stocks. However unlike a normal portfolio the contract gives only a fixed exercise/maturity date. Also there are no dividends from the option as it doesn't physically represent a holding until the option is exercised and only then to be encashed with the option writer (div yield has been one of the core diversifiers in equities). Nor does the option grant voting rights for any of those 100 companies. Is the case for diversity looking a little flimsy?
Before I go further it's worth re-capping that different assets and different companies return profit over different timescales (called 'horizons'). It is these attributes + the different volatilties therein that create the case for diversification. To avoid the risk of one by investing in the many, to invest different assets over different horizons.
For me the basics of MPT were based on the early regression analyses - that a basket of multiple stocks of varying correlations and covariances could be combined to reduce the overall portfolio volatility; while maximising the overall upside per each unit of risk. The key variable with equities is Time - different stocks may return profit over different periods in the economic cycle. Time it wrong and you can lose everything; time it right and you profit. Simples.
However the structured product doesn't do this - it only gives you one bite at the cherry. ZCBs are rarely callable (since there is no coupon) and American option pricing is a rarity in the UK so the maturity is likely to be fixed lest penalties apply. Some issuers even 'collar' the upside (akin to a performance fee) to basically cover the option writer should markets move against it (and for the investor) significantly. In fact some issuers can turn this around to their advantage and take the top-side profit. Anything over and above the 'collar' goes to the issuer; not the investor. This is a common trade-off with structured products. If you wanted to plot the SP on a regression chart you couldn't conventionally; instead tracing a straight line for the ZCB and a variable point for the Option.
Also - because most of the investor's initial investment is used to buy the ZBC - the remaining amount can only buy a % of exposure to the UK market. Fair enough, if the option ends up being 'in the money' then it is a leveraged position and the returns will be greater proportionally BUT it is highly unlikely to be anywhere near 100% long-exposure. If we assumed buying FTSE100 was diversifying the portfolio then a 100% investment into an ETF or UK FTSE100 fund would give something close to 100% diversification; if you only invest 20% of your investment in the FTSE100 option to give 50% leveraged exposure to the FTSE100 then you are still only 50% diversified; (ignoring the ZCB).
A FTSE100 option is a derivatives contract usually based on 1% movements in the FTSE100 with a nominal value of £1, £100 etc. The FTSE100 index itself is a capitalisation weighted free float index that gives a proxy of the underlying stocks (that is the biggest companies influence the index movement to a greater extent than smaller companies).
To buy an ETF or Option in the FTSE100 is not the same as owning the stock. The price of the Option and the ETF can move independently although both are supposed to be pegged to the index. Whereas footsie ETFs tend to be pretty faithful; options can experience 'basis risk' - i.e. they follow the futures market and a margin can arise between the current FTSE100 price and the Option price. So in reality the Option is a contract based on a proxy based on a basket of underlying stocks. The end return to the investor is largely pre-determined to a point at outset and has less to do with the diversified investment of 100 stocks than it does to the maturity value of the ZCB and the option exercise price. Some say SPs play on investor anxiety at the sake of boosting their long term returns. As with everything there are 2 sides to the argument.
Certainly in this case the structured product offers no covariances, no correlations, no multiple time horizons during the life of the investment. It is about as diversified as a UK tracker that could only return across a fixed period between point A to point B. Many investors have found out just how diversified investing in beta really is by buying and selling at the wrong time (1997/1998, 2001/2002, 2007/2008).
SPs are of course cover a wide variety of products and not all will be constrained in the way I have described but the basic ingredients are there. One asks if a series of ZCBs, with varying maturities, and reinvestment points coupled to an American priced Option or series of Options could be a way to give the investor better access to time the markets through the investment period.
In some ways SPs are even less 'diversified' than ETFs/trackers because the stuctured product doesn't hold the stocks and has less liquidity (harder to sell at any point). At best the SP is a split investment between the ZCB and an option proxy for UK equities. The diversification benefits are thus limited to the composite return of the ZCB + the option based on a single weighted average price index (a bond and a derivative). Diversified, on some grounds perhaps, on others less so. The question is if you took away the outer packaging would you have considered a ZCB and the Option on individual merits?
Let's not even get into capital g'tees versus inflation and real rates of return..
Wednesday, 14 July 2010
Judgement Day? AI + HFT = Entropy?
A new wave of investment firms are turning to artificial-intelligence programs to make trading decisions. The programs are designed to crunch numbers, learn from decisions, and adapt. Some are having success.
Q. Does AI offer any more predictability or safety than human herding - don't forget who write the algorithms in the first place. BUT what happens when different AI trading platforms sense the movements of other AI platforms - since BUY/SELL is a wholly devisive arrangement then surely the system could create a raft of unexpected outcomes??
HFT will make cause-effect more entropic - even media may be unable to keep up with nano-second trading. Private investors become ever-remote, is this another way for the industry to regain control and instil some fear factor AND at what cost?
Article
Monday, 21 June 2010
ETF debate trundles on.. the observation becomes the rule?
E.g. We know Commodity markets are exposed to irregular volatility due to the lack of depth and control of relaitvely few bourses/ market-makers. They are more frequently subject to 'dislocation' the books say.
'Speculators do not drive commodity prices, says OECD' Increased investment in commodities is not linked to the price volatility of the physical commodities themselves, according to a report from the OECD. Not only did the research find index funds did not cause a price bubble in commodity futures, it showed a consistent association between increases in index fund positions and declining volatility.' IPE: Commodity ETFs
But does this mean that ETFs are also capping upside volatility, if so then what unforeseen consequences could this have (E.g. increased risk-taking, increased positions)?
The other danger is one of complacency, to assume the observation is the rule and will remain so. As yet we do not know what changes will occur in the market if the trading volume of ETFs escalates. JB
Structured products.. vs. behavioural economics
Investec Asset Management’s star fund manager Alastair Mundy says investors ought to be aware of behavioural economics when buying structured products. He warns investment banks play on the fears of investors and create products that are designed to sell well rather than ones that are appropriate for the market conditions.
A renowned contrarian investor, A-rated Mundy runs approximately £3 billion across a range of funds for Investec. He has been investing via structured products since 2001 and is a self-confessed fan, frequently using them within the Investec Capital Accumulator portfolio.
'Fear and greed' However, Mundy says investment banks will take advantage of behavioural economics, namely the influence of fear and greed, to profit from clients.
He says: ‘I think there is an information advantage that providers have over buyers. There is also an emotional advantage in that buyers are weak and under pressure at times of market turmoil.’
Market sell-offs, Mundy says, are an excellent example of behavioural economics influencing the creation of wrong structured products and investors making wrong choices because everyone – bar the contrarians – is nervous.
He says: ‘Structured products [providers] see volatility is going up and customers are getting scared, so they come up with “capital protected” products with a small amount of upside. They are immediately playing off the fears of investors.
'Therefore, you are immediately running the risk of overpaying for market protection. You can also say you are overpaying for market protection at a wrong time, doing it after a market sell-off rather than before.’
'Bells and whistles' Mundy says the structured products space is a constant battle between manufacturers and consumers.
‘Manufacturers can create all sorts of things with bells and whistles and what they are trying to do is find that coupling of bells and whistles that the customer thinks is best value. The customer has this intuitive idea of what to pay for it, and where that gap is greatest is what allows the manufacturers to sell products in the biggest size.’
He adds: ‘That’s a great challenge every day when buying structured products. You are always in danger of overpaying for the attributes that they see within these products.’
Investment U
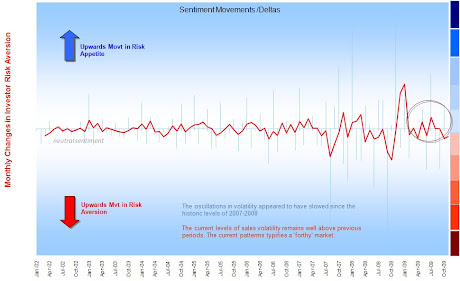
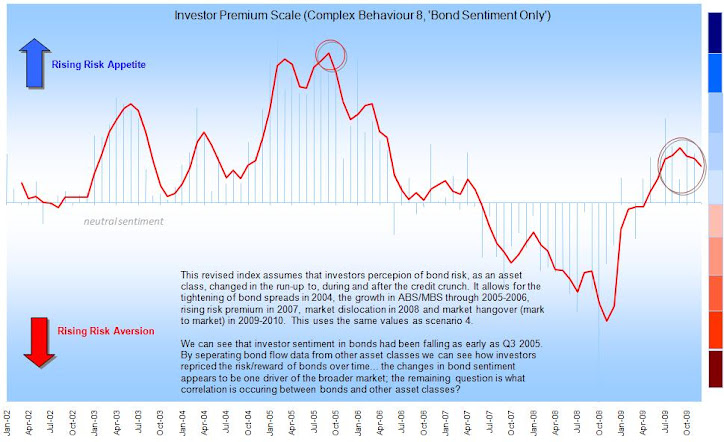
Delta changes in risk aversion (Nov09)
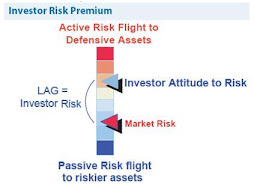
Sentiment: The 'Lag' Effect
Investor perception of risk is rarely up to date
Global Consciousness Project (GCP) 'Dot'
Choosing Mutual Funds..
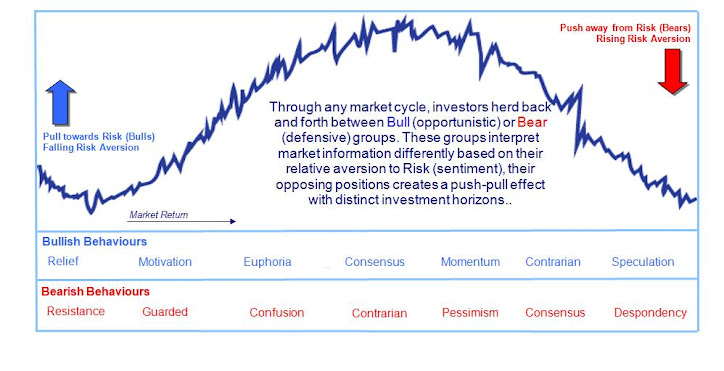
Bull versus Bear Investing; versus Herding
Let's get normal volatility out of the way first.. VaR-based toolkit.
What is the fuss with volatility.....
http://en.wikipedia.org/wiki/Geometric_Brownian_motion
*Stochastic models: treat the underlying security's volatility as a random process, governed by variables such as the price level of the underlying, the tendency of volatility to revert to some long-run mean value, and the variance of the volatility process itself, among others. Somtimes I use Markov chain as the easiest way to visualise and understand a random process: usually it's illustrated by the cat and the mouse:
This Markov chain then has 5 states:Suppose you have a timer and a row of five adjacent boxes, with a cat in the first box and a mouse in the fifth one at time zero. The cat and the mouse both jump to a random adjacent box when the timer advances. E.g. if the cat is in the second box and the mouse in the fourth one, the probability is one fourth that the cat will be in the first box and the mouse in the fifth after the timer advances. When the timer advances again, the probability is one that the cat is in box two and the mouse in box four. The cat eats the mouse if both end up in the same box, at which time the game ends. The random variable K gives the number of time steps the mouse stays in the game..
State 1: cat in the first box, mouse in the third box: (1, 3)
State 2: cat in the first box, mouse in the fifth box: (1, 5)
State 3: cat in the second box, mouse in the fourth box: (2, 4)
State 4: cat in the third box, mouse in the fifth box: (3, 5)
State 5: the cat ate the mouse and the game ended: F.
To show this for a fairly infinite number of price movements is somewhat less achievable but nonetheless that's what the clever bods have done..
Otherwise most of probability, I admit, is above my head unless it descends into some sort of practical application - BUT I get the sub-plot.. stop trying to predict future patterns from regressing past performance... show me the track record of a model (after it has been created) and I'll be one step closer to being converted.. I'll touch on stress testing, extreme analysis ('extremistan') and scenarios another day..
http://en.wikipedia.org/wiki/Black%E2%80%93Scholes"The Black–Scholes model disagrees with reality in a number of ways, some significant. It is widely employed as a useful approximation, but proper application requires understanding its limitations -blindly following the model exposes the user to unexpected risk. In short, while in the Black–Scholes model one can perfectly hedge options by simply Delta hedging, in practice there are many other sources of risk." Wikpedia
Active-Passive Investing Debate
Performance Patterns: **This deck is based on some work-based research so apologies for the confusing arguments - as a consequence the 'story' in the slides is a little muddy so I will re-jig this in the New Year to make my points clearer.** Passive-active purchase drivers in the UK are less differentiated/defined than perhaps elsewhere; the basic rules apply: What I did find was that there were interesting herding flows preceding, into and of the credit crunch. These were large asset-class movements: something which active managers would have little control of unless they ran absolute return type startegies. What my analysis showed is that an investor could manage a passive portfolio tactically to take advantage of large herding patterns. This involves risk, access to the right data, practice and above all discipline but I hope it will be a journey we can share!!
Lessons for 2010 - REIT Funds
The UK Investor - The Surprise Factor
The maps in the presentation (below) really help illustrate the suprise factor of the credit crunch.. little of the previous patterns would prepare the UK investor for what was about to come. The flows show that investors did not recognise the risks inherent in 2006-2008. This is because the industry uses conventional fund metrics, which were at best outputs not guides..!