ETFs as a source of counter-balancing; reduced volatility, increased risk?
E.g. We know Commodity markets are exposed to irregular volatility due to the lack of depth and control of relaitvely few bourses/ market-makers. They are more frequently subject to 'dislocation' the books say.
'Speculators do not drive commodity prices, says OECD' Increased investment in commodities is not linked to the price volatility of the physical commodities themselves, according to a report from the OECD. Not only did the research find index funds did not cause a price bubble in commodity futures, it showed a consistent association between increases in index fund positions and declining volatility.' IPE: Commodity ETFs
But does this mean that ETFs are also capping upside volatility, if so then what unforeseen consequences could this have (E.g. increased risk-taking, increased positions)?
The other danger is one of complacency, to assume the observation is the rule and will remain so. As yet we do not know what changes will occur in the market if the trading volume of ETFs escalates. JB
Monday, 21 June 2010
Structured products.. vs. behavioural economics
Citywire article. An interesting notion. Mundy: overpaying-for-structured?
Investec Asset Management’s star fund manager Alastair Mundy says investors ought to be aware of behavioural economics when buying structured products. He warns investment banks play on the fears of investors and create products that are designed to sell well rather than ones that are appropriate for the market conditions.
A renowned contrarian investor, A-rated Mundy runs approximately £3 billion across a range of funds for Investec. He has been investing via structured products since 2001 and is a self-confessed fan, frequently using them within the Investec Capital Accumulator portfolio.
'Fear and greed' However, Mundy says investment banks will take advantage of behavioural economics, namely the influence of fear and greed, to profit from clients.
He says: ‘I think there is an information advantage that providers have over buyers. There is also an emotional advantage in that buyers are weak and under pressure at times of market turmoil.’
Market sell-offs, Mundy says, are an excellent example of behavioural economics influencing the creation of wrong structured products and investors making wrong choices because everyone – bar the contrarians – is nervous.
He says: ‘Structured products [providers] see volatility is going up and customers are getting scared, so they come up with “capital protected” products with a small amount of upside. They are immediately playing off the fears of investors.
'Therefore, you are immediately running the risk of overpaying for market protection. You can also say you are overpaying for market protection at a wrong time, doing it after a market sell-off rather than before.’
'Bells and whistles' Mundy says the structured products space is a constant battle between manufacturers and consumers.
‘Manufacturers can create all sorts of things with bells and whistles and what they are trying to do is find that coupling of bells and whistles that the customer thinks is best value. The customer has this intuitive idea of what to pay for it, and where that gap is greatest is what allows the manufacturers to sell products in the biggest size.’
He adds: ‘That’s a great challenge every day when buying structured products. You are always in danger of overpaying for the attributes that they see within these products.’
Saturday, 19 June 2010
Active ETFs - does Low Cost offer investors transparecy?
Howdy y'all,
Hope everyone is well on what is a wholly untypical sunny Scottish morning.
To business - lots of chat around active ETFs,
Should we abandon traditional funds for active ETFs, why have ETFs emerged?
Fisrtly there is a sub-topic as to the performance of passive ETFs through the whole economic cycle - we all recall that over say 5 years tracker funds can be left with nil returns if there has been a bull and bear cycle of equal size ('dotcom' was a good example). We also know investors have a habit of selling and buying at the wrong times in the cycle. Few investors stick with a passive fund for 25 years.
Now we have active ETFs coming over from the US, these are the answer they say to addressing the market cycle, presumably that one can switch from passive (beta) to active (alpha or indeed just more beta as is the case) ETFs at the right time in the cycle. Confused, you rightly should be.
The battleground, as I see it, is whether active fund managers should continue to use conventional markets or ETFs to trade. I also wonder what unexpected consequences volumes of active ETFs could have on the market, as they are influencing on the price of broad indices rather than individual positions, subject to increasing automated high speed trading.
Also, in the UK, I scratch my head to gauge the superiority (other than price) for active ETFs over closed-ended quoted Investment Trusts.. I recognise these are not US-based but they have sold in the US to the Instl market. The difference is that ITS are also governed by trustees. The other is that Trusts can run at a discount or premium to NAV, ETFs should be reflective of NAV.
In some ways active ETFs could be sold on the basis of low cost; granted, but at the sake of investment transparency, which is the main draw of passive (index based) ETFs. I have not fully resolved this myself and put out for discussion.
JB
Hope everyone is well on what is a wholly untypical sunny Scottish morning.
To business - lots of chat around active ETFs,
Should we abandon traditional funds for active ETFs, why have ETFs emerged?
Fisrtly there is a sub-topic as to the performance of passive ETFs through the whole economic cycle - we all recall that over say 5 years tracker funds can be left with nil returns if there has been a bull and bear cycle of equal size ('dotcom' was a good example). We also know investors have a habit of selling and buying at the wrong times in the cycle. Few investors stick with a passive fund for 25 years.
Now we have active ETFs coming over from the US, these are the answer they say to addressing the market cycle, presumably that one can switch from passive (beta) to active (alpha or indeed just more beta as is the case) ETFs at the right time in the cycle. Confused, you rightly should be.
In my ETF guide I talked about the different phases of a market cycle - ETFs do best in the early phase of a bull run where growth is largely driven at a macro level and then lose ground to active managers who assume risks above market to outperform.I think the interesting dynamic is whether traditional active managed collective models (mutual funds) are flawed from outset, expensive and opaque to the investor. I have certainly written on a number of occassions, challenging the investment return of fund managers and their revenue models. In which case do ETFs offer a new model for any investment OR should ETFs remain in passive strategies?
The battleground, as I see it, is whether active fund managers should continue to use conventional markets or ETFs to trade. I also wonder what unexpected consequences volumes of active ETFs could have on the market, as they are influencing on the price of broad indices rather than individual positions, subject to increasing automated high speed trading.
Also, in the UK, I scratch my head to gauge the superiority (other than price) for active ETFs over closed-ended quoted Investment Trusts.. I recognise these are not US-based but they have sold in the US to the Instl market. The difference is that ITS are also governed by trustees. The other is that Trusts can run at a discount or premium to NAV, ETFs should be reflective of NAV.
In some ways active ETFs could be sold on the basis of low cost; granted, but at the sake of investment transparency, which is the main draw of passive (index based) ETFs. I have not fully resolved this myself and put out for discussion.
JB
Saturday, 1 May 2010
Lots of spinning plates, over focus on the few and we will drop others.
Could we have seen the recession coming? Although many did raise alarms in 2006; those flags (myself included) were mostly non-systemic (I noted for example that just about every US/Global and European Equity mutual fund had a R-square 90% to S&P500, now ignore the reliance on the 'GIF' for a moment. That figure even in mediocristan should have alarmed but it didn't.. why? because everyone was playing the little brownian motion/VaR game..
John Marke is very right: that some did point to the man-made element, that behaviour will ultimately always produce risk due to morale hazard and it's interesting to see Minsky being revived widely, JM Keynes also.
These then are man-made events but perhaps not in the way of induced seismicity that we have discussed before. But in common is that the intention was not to cause an 'earthquake', well perhaps except the hedge and leveraged managers.
The problem is that the financial industry is a trans-national network that's far more complicated that the multitude of micro silos that trade, invest, comment, regulate and ultimately impact the systemic attributes across the globe. It's too complicated for any one individual or organisation to centre in one place sufficiently long-enough to measure the level of systemic risk, not helped by the simple fact that cross-border regulation is honourable but often ineffective. Even if someone did then the system would probably change so quickly that a true picture could never be built up. It's why scenario analysis should have been more important that forecasting sims. Of course as NNT points out even if we did we are to assymetrical in our guesses, print to underestimate and overestimate at the wrong times.
Again we tried to become too clever, to relax risk limits by inviting more complex risk measurement. Paradox: we chased the holy grail of risk (simply) to elevate one's own risk control/complexity and didn't see the obvious risks in our neighbours kitchen, regulators and BIS enticed such practices but couldn't spin all the plates, not even close, the end.
As John will tell you it's difficult to place lines where we tipped over as we are dealing with a sequence of events that we badly recount but be confident that a multitude of events led to that 'point' in 2008.
Also - in my paper I'm trying to look at the man-made angle from investor herding, media volatility/influence, empirically (I hope) and from a sociological pov. We have to look at the move to DIY investing, online, internet media. I worked out a basic mind map just for this simple fraction of the puzzle and even then was quickly overloaded.
Take also S&P - did months of complacency followed by conservatism lead eventually to radicalism? Markets would indicate no one expected 3 sovereign Euro downgrades in such a short space (Finch may disagree). One would even think S&P wanted to precipitate a double dip or to nervous of not calling something larger, sooner? Be in no doubt the euro is injured and hard to see what conseuqnces that could have. Germany as we know is the cornerstone of the Euro economy,we don't know what caapcity it has to bolster its sick relatives.
Lastly OTC off balance sheet trades (aka dark liquidity pools). The move to bring them into the light and onto exchanges - can we predict the result of this, amplified as it could be through high frequency trading which is completely shaking up the system - John for you this means even less 'slack'.. again a man-made development. We also have baby boomers ready to sell to take their pensions and huge Instl money ready to transfer from trust-based schemes to individuals. Again man-made, cultural, changes will probably be exponential, error rates spiralling and consequences behavioural in nature.
The system will again adapt, evolve, people's mind sets will prefix on the recent and forget the long.. regulations will stem the risk of the known rather than the unknown, this we can be fairly certain just as we can be un-certain of what events will precipitate the next crash or when.
of course if we follow NNT's thinking through, we wouldn't know which black swans hadn't occured in order to apply hindsight as to why they were near misses. What chance do we have - we're not even very good (as a society) in recognising the black swans that do occur.. ergo NNT's crusade on historians and the narrative fallacy. As you say we have to hope for more grey feathers.
Perhaps we can only hypothesise: E.g. what if the awful events of 9/11 hadn't happened resulting in a continuous bubble/affluence run (bond dip) from 1998 all the way through to 2006; (unlikely admittedly) then what?
John is right about morale hazard and I also follow Minsky. Of course this is all the more unlikely since it is when there is a big error in the system that the next set of models are created as a solution; designed to more accurately measure risk, with the net effect of more risk being taken. Fewer mistakes then the rate of complexity slows. In terms of Minksy think of it as clever bods being encouraged to find complex problems to invent complex solutions that by their application induce more risk-taking. Market shocks ramp up the hire of said bods who have to find new models to get paid. Rarely are bods paid to come up with risk models that cap the amount of risk (profits) their pay masters can undertake.
There are some huge issues still largely dormant in the financial system, the shifting influence of Gen Y from X investors, the impact of individual vs. institutional investing, advised to non-advised investing, the pensions gap.. the way exchanges are trading, the rate p/second they are trading at: all these things could move the markets up/down to unprecedented scales. They are grey swans since we are talking about them. What do we do about these, hypothesise?
In reality they should recognise the shortcomings of future-gazing and build some honest 'resilience' (to coin from John's work) for when things do turn out differently. However the financial markets are a confidence game, always have been and folks need regular placebos to maintain that veil of certainty.
(this thread continue in the Linkedin Black Swan group)
http://www.linkedin.com/groupAnswers?viewQuestionAndAnswers=&gid=80474&discussionID=18503539&commentID=15601226&goback=%2Eanh_80474&report%2Esuccess=8ULbKyXO6NDvmoK7o030UNOYGZKrvdhBhypZ_w8EpQrrQI-BBjkmxwkEOwBjLE28YyDIxcyEO7_TA_giuRN#commentID_15601226
John Marke is very right: that some did point to the man-made element, that behaviour will ultimately always produce risk due to morale hazard and it's interesting to see Minsky being revived widely, JM Keynes also.
These then are man-made events but perhaps not in the way of induced seismicity that we have discussed before. But in common is that the intention was not to cause an 'earthquake', well perhaps except the hedge and leveraged managers.
The problem is that the financial industry is a trans-national network that's far more complicated that the multitude of micro silos that trade, invest, comment, regulate and ultimately impact the systemic attributes across the globe. It's too complicated for any one individual or organisation to centre in one place sufficiently long-enough to measure the level of systemic risk, not helped by the simple fact that cross-border regulation is honourable but often ineffective. Even if someone did then the system would probably change so quickly that a true picture could never be built up. It's why scenario analysis should have been more important that forecasting sims. Of course as NNT points out even if we did we are to assymetrical in our guesses, print to underestimate and overestimate at the wrong times.
Again we tried to become too clever, to relax risk limits by inviting more complex risk measurement. Paradox: we chased the holy grail of risk (simply) to elevate one's own risk control/complexity and didn't see the obvious risks in our neighbours kitchen, regulators and BIS enticed such practices but couldn't spin all the plates, not even close, the end.
As John will tell you it's difficult to place lines where we tipped over as we are dealing with a sequence of events that we badly recount but be confident that a multitude of events led to that 'point' in 2008.
Also - in my paper I'm trying to look at the man-made angle from investor herding, media volatility/influence, empirically (I hope) and from a sociological pov. We have to look at the move to DIY investing, online, internet media. I worked out a basic mind map just for this simple fraction of the puzzle and even then was quickly overloaded.
Take also S&P - did months of complacency followed by conservatism lead eventually to radicalism? Markets would indicate no one expected 3 sovereign Euro downgrades in such a short space (Finch may disagree). One would even think S&P wanted to precipitate a double dip or to nervous of not calling something larger, sooner? Be in no doubt the euro is injured and hard to see what conseuqnces that could have. Germany as we know is the cornerstone of the Euro economy,we don't know what caapcity it has to bolster its sick relatives.
Lastly OTC off balance sheet trades (aka dark liquidity pools). The move to bring them into the light and onto exchanges - can we predict the result of this, amplified as it could be through high frequency trading which is completely shaking up the system - John for you this means even less 'slack'.. again a man-made development. We also have baby boomers ready to sell to take their pensions and huge Instl money ready to transfer from trust-based schemes to individuals. Again man-made, cultural, changes will probably be exponential, error rates spiralling and consequences behavioural in nature.
The system will again adapt, evolve, people's mind sets will prefix on the recent and forget the long.. regulations will stem the risk of the known rather than the unknown, this we can be fairly certain just as we can be un-certain of what events will precipitate the next crash or when.
of course if we follow NNT's thinking through, we wouldn't know which black swans hadn't occured in order to apply hindsight as to why they were near misses. What chance do we have - we're not even very good (as a society) in recognising the black swans that do occur.. ergo NNT's crusade on historians and the narrative fallacy. As you say we have to hope for more grey feathers.
Perhaps we can only hypothesise: E.g. what if the awful events of 9/11 hadn't happened resulting in a continuous bubble/affluence run (bond dip) from 1998 all the way through to 2006; (unlikely admittedly) then what?
For example say that the market, somehow, had cooled techs enough to consolidate earnings and precipitate a period of growth not seen since the 50s.. then we see a more prolonged credit boom followed by a bust 3 times the drawdown of 2008-2009. or in another way we add up the sum of the 2000 dot com slide, 9/11/01 + the 2002 accounting scandals and the 2007-2008 crunch together, combined with an assumption that assets were attracted West to East China and EM Mkts overheated 3 fold than they did.. sometimes what may be commented as a balck swan was more predictable, a grey swan, a pressure releases that avoided something much larger such as a complete collapse of electronic international trade.. or China repartiates all foreign assets held, how many institutions would have gone bust then.
John is right about morale hazard and I also follow Minsky. Of course this is all the more unlikely since it is when there is a big error in the system that the next set of models are created as a solution; designed to more accurately measure risk, with the net effect of more risk being taken. Fewer mistakes then the rate of complexity slows. In terms of Minksy think of it as clever bods being encouraged to find complex problems to invent complex solutions that by their application induce more risk-taking. Market shocks ramp up the hire of said bods who have to find new models to get paid. Rarely are bods paid to come up with risk models that cap the amount of risk (profits) their pay masters can undertake.
What if the war on terror hadn't happened, what if no SARS, what if no x, y or z.. as NNT reminds us it is very difficult indeed to unpick the causality of a major event back to a single cause whereas we can hypothesise about the impact of small events, iterating in their multitude, down a butterlfy effect.
There are some huge issues still largely dormant in the financial system, the shifting influence of Gen Y from X investors, the impact of individual vs. institutional investing, advised to non-advised investing, the pensions gap.. the way exchanges are trading, the rate p/second they are trading at: all these things could move the markets up/down to unprecedented scales. They are grey swans since we are talking about them. What do we do about these, hypothesise?
To revive: "For the ordinary man is passive. Within a narrow circle he feels himself master of his fate, but against major events he is as helpless as against the elements. So far from endeavoring to influence the future, he simply lies down and lets things happen to him.." G.O. 'Animal Farm'..and to me that's the only thing regulators and investors seem to do; feeling powerless to change the big events they hypothesise the results from small decisions. In doing so they remain in mediocristan where it feels safer.
In reality they should recognise the shortcomings of future-gazing and build some honest 'resilience' (to coin from John's work) for when things do turn out differently. However the financial markets are a confidence game, always have been and folks need regular placebos to maintain that veil of certainty.
(this thread continue in the Linkedin Black Swan group)
http://www.linkedin.com/groupAnswers?viewQuestionAndAnswers=&gid=80474&discussionID=18503539&commentID=15601226&goback=%2Eanh_80474&report%2Esuccess=8ULbKyXO6NDvmoK7o030UNOYGZKrvdhBhypZ_w8EpQrrQI-BBjkmxwkEOwBjLE28YyDIxcyEO7_TA_giuRN#commentID_15601226
Savings Ratios versus Debt vs. Propensity to Save. That old chesnut - Longevity vs. the Pensions Gap..?!
Dear CCC,
The Misnomer of UK Savings Ratios? Anyone who's looked at the APS (average propensity to save) from the ONS recently will see there is a sort of reverse logic playing just now - we see exceptional avg. savings ratios in the UK and US but we know much relates to debt digestion/reduction; not long-term savings. The pendulum effect we saw between debt borrowing and debt digestion has also had the unhappy consequence of using the APS to trend ever again; (although conversely handy for scenario and stress testing purposes).. I'm puzzled; are you?

Our recovery indicators seem awfully hinged on tiny margins in GVA, and massively preoccupied by CPI and retail spend as proxy of recovery.. seriously?
Overall savings volume has been fuelled by baby boomers, the Gen-X, a group set to enter extended accumulation, drawdown or full decumulation between now and for the next 5 years. Once the group is fully in decumulation then it would seem we should expect a sharp drop off in savings investment if we cannot encourage Gen Ys to save more.
http://www.oecd.org/dataoecd/34/52/1865232.pdf
Reverse logic: To expect a rise in net income being devoted to long-term savings and we may actually need the savings ratio to fall. This would imply the current ratios are artifically high and that in normal conditions the potential residual of income is going to be nowhere near as much. It also points towards cultural issues about when to save and when to spend.. long-term savings (used for future provision) seems to get squeezed by short term needs to store money for a rainy day and to spend when things are good. This has perhaps something to do without inability to accurately weight the importance of future events.. this is a major block for anyone wanting to launch wellbeing products that focus on tomorrow rather than today.
Meanwhile the pensions funding gap isn't exactly standing still.. while defined benefit wchemes needed nigh on 5700 points in the footsie to come out of deficit (writing - wall).. The run-up to 2012 will then change the UK savings landscape as we see auto-enrollment and employer-sponsored scheme make individual contributions compulsory.
There are of course glimmers of hope in the UK; a very healthy Q1 ISA season.. the quesiton is whether investors have confidence in longer-term products or whether the flows into ISA was a churn away from other savings vehicles such as onshore/offshore bonds (retraction) or pensions (flat).
BUT what preconditions are we looking for to encourage long-term savings: do we need people to spend to save, people to borrow to save, people to change mind-set, irrespective of economic conditions, to save..? How do we encourage them to save more against the backdrop of national debt? Again the focus is (relatively) present (the next 5 years) rather than future (the next 25 years)..
So my first suggestion is that for the purposes of tracking UK savings rates then we abondon the ONS APS and instead use OECDs savings rate values. The OECD has studied savings rated but again we're short on observations during and post credit-crunch. In short the rules may have changed and hopefully the OECD will pick this up in due course.
http://www.olis.oecd.org/olis/2010doc.nsf/linkto/eco-wkp(2010)10
The Misnomer of UK Savings Ratios? Anyone who's looked at the APS (average propensity to save) from the ONS recently will see there is a sort of reverse logic playing just now - we see exceptional avg. savings ratios in the UK and US but we know much relates to debt digestion/reduction; not long-term savings. The pendulum effect we saw between debt borrowing and debt digestion has also had the unhappy consequence of using the APS to trend ever again; (although conversely handy for scenario and stress testing purposes).. I'm puzzled; are you?
Now the OECD do calculate national savings rates as a percentage of GDP that is saved by households across a country. Household saving is one of the primary sources of capital investment in the country. Thus OECD use this rate as an indicator for long term economic growth. http://www.oecd.org/

Our recovery indicators seem awfully hinged on tiny margins in GVA, and massively preoccupied by CPI and retail spend as proxy of recovery.. seriously?
Overall savings volume has been fuelled by baby boomers, the Gen-X, a group set to enter extended accumulation, drawdown or full decumulation between now and for the next 5 years. Once the group is fully in decumulation then it would seem we should expect a sharp drop off in savings investment if we cannot encourage Gen Ys to save more.
http://www.oecd.org/dataoecd/34/52/1865232.pdf
Reverse logic: To expect a rise in net income being devoted to long-term savings and we may actually need the savings ratio to fall. This would imply the current ratios are artifically high and that in normal conditions the potential residual of income is going to be nowhere near as much. It also points towards cultural issues about when to save and when to spend.. long-term savings (used for future provision) seems to get squeezed by short term needs to store money for a rainy day and to spend when things are good. This has perhaps something to do without inability to accurately weight the importance of future events.. this is a major block for anyone wanting to launch wellbeing products that focus on tomorrow rather than today.
Meanwhile the pensions funding gap isn't exactly standing still.. while defined benefit wchemes needed nigh on 5700 points in the footsie to come out of deficit (writing - wall).. The run-up to 2012 will then change the UK savings landscape as we see auto-enrollment and employer-sponsored scheme make individual contributions compulsory.
There are of course glimmers of hope in the UK; a very healthy Q1 ISA season.. the quesiton is whether investors have confidence in longer-term products or whether the flows into ISA was a churn away from other savings vehicles such as onshore/offshore bonds (retraction) or pensions (flat).
BUT what preconditions are we looking for to encourage long-term savings: do we need people to spend to save, people to borrow to save, people to change mind-set, irrespective of economic conditions, to save..? How do we encourage them to save more against the backdrop of national debt? Again the focus is (relatively) present (the next 5 years) rather than future (the next 25 years)..
So my first suggestion is that for the purposes of tracking UK savings rates then we abondon the ONS APS and instead use OECDs savings rate values. The OECD has studied savings rated but again we're short on observations during and post credit-crunch. In short the rules may have changed and hopefully the OECD will pick this up in due course.
http://www.olis.oecd.org/olis/2010doc.nsf/linkto/eco-wkp(2010)10
Wednesday, 28 April 2010
Capricious events? Bill Jamieson talk, Tuesday night
'Future of the Banking sector'
A most enjoyable macro session by Bill Jamieson (Exec Ed Scotsman newspaper) at the Carlton hotel last Tuesday night..
As Bill would aptly pontificate about any debt-driven double dip: waiting for 'the shoe to fall off the other foot', perhaps S&P is getting into the shoe business given it's fervour to unsettle the market through a series of sovy downgrades, let's just hope it's sized the feet correctly lest we suffer discomfort? We wouldn't want the financial equivalent of bunions now would we!
When will credit agencies like S&P come under full regulation, they seem to swing from inertia to over-exuberance, dangerous traits in a media driven world.
Bill rightly points to the capricious nature of events yet to unfold..
Sunday, 25 April 2010
A History of Modern Portfolio Theory: i.e. chasing the ‘Holy Grail’
As fund analysts we are often derided as the ‘blunt end of the stick’ when it comes to the tricky numbers. In the last decade we have seen an explosion in models to calculate the risk of financial instruments. 2 things are true of these advances in financial analysis: 1) they became more complex and mathematical and 2) they failed to reduce the level of risk for the investor: think LTCM, Black Monday (19/10/1987) , Barings-Asia crisis (97), dot-com (2000) and the credit crunch (2008).

1950s: Optimization (Markowitz)
1960s: Capital Asset Pricing (Treynor, Sharpe etc)
1970s: Attribution (SIA UK)
1970s: Arbitrage Pricing Theory (Ross)
1980s: Heuristics and behavior (Kahneman & Tversky)
1990s: Stochastic (Wiener, Black, Scholes, Merton)
1990s: Rise of Value at Risk based models (VaR)
2000s: Asset-liability strategies (ALM, aka LDI)
2000s: Fluid dynamic models (Navier-Stokes)
2000s: ARCH-based models (Engle)
There is no holy grail in predicting future financial markets from the price movement of previous ones..
"Any intelligent fool can make things bigger and more complex... It takes a touch of genius - and a lot of courage to move in the opposite direction." Albert Einstein

1950s: Optimization (Markowitz)
1960s: Capital Asset Pricing (Treynor, Sharpe etc)
1970s: Attribution (SIA UK)
1970s: Arbitrage Pricing Theory (Ross)
1980s: Heuristics and behavior (Kahneman & Tversky)
1990s: Stochastic (Wiener, Black, Scholes, Merton)
1990s: Rise of Value at Risk based models (VaR)
2000s: Asset-liability strategies (ALM, aka LDI)
2000s: Fluid dynamic models (Navier-Stokes)
2000s: ARCH-based models (Engle)
2000s: Levy-jump models and power laws (LSE
2000s: Chaos theory, entropy (Lorenz)
2000s: Extreme Value models, organic (ongoing)
2000s: Extreme Value models, organic (ongoing)
There is no holy grail in predicting future financial markets from the price movement of previous ones..
Subscribe to:
Posts (Atom)
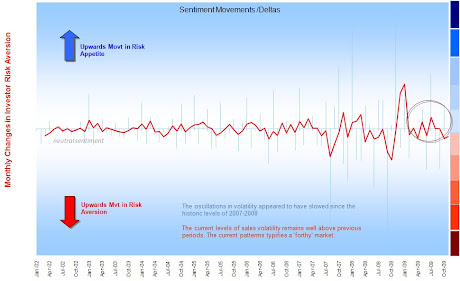
Delta changes in risk aversion (Nov09)
Sentiment: The 'Lag' Effect
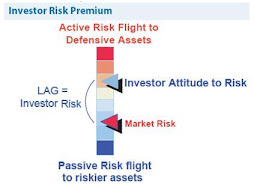
Investor perception of risk is rarely up to date